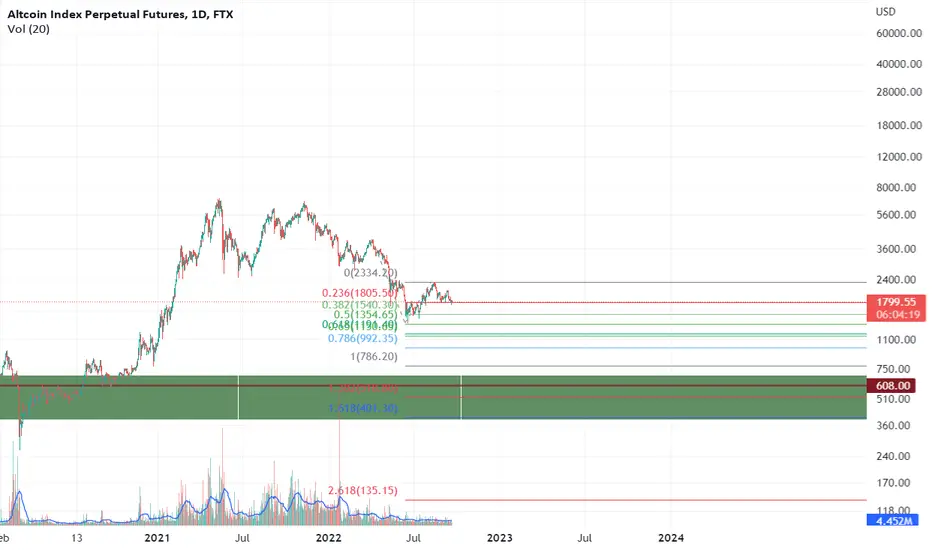
according to HOSODA wave theory , fib levels and volume profile , the ALTS bottom seems to be in the indicated green rectangle in the chart .
not a financial advice .
thank you
not a financial advice .
thank you
Note
i will be sharing ideas from my new account : tradingview.com/u/Benterkiayoucef/Disclaimer
The information and publications are not meant to be, and do not constitute, financial, investment, trading, or other types of advice or recommendations supplied or endorsed by TradingView. Read more in the Terms of Use.
Disclaimer
The information and publications are not meant to be, and do not constitute, financial, investment, trading, or other types of advice or recommendations supplied or endorsed by TradingView. Read more in the Terms of Use.