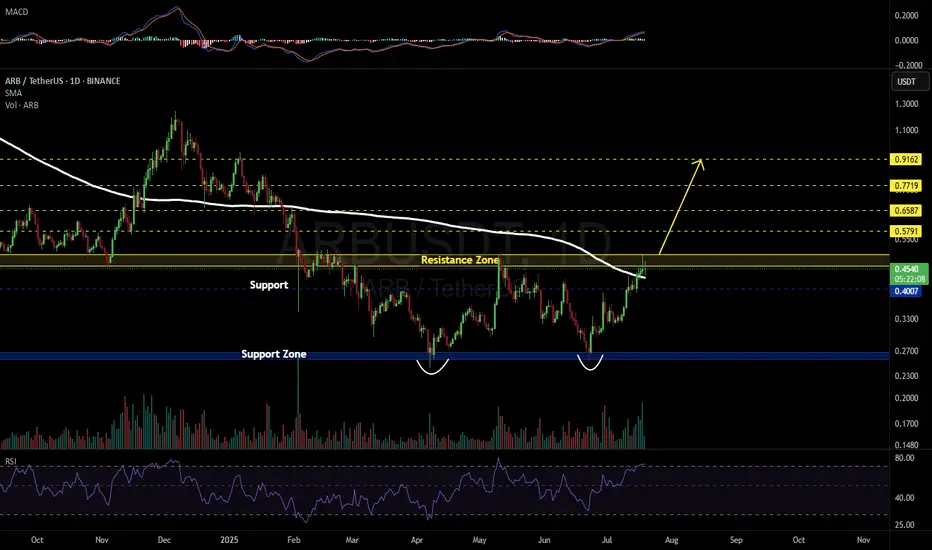
#ARB has formed a Double Bottom Pattern on the daily chart. This is a bullish pattern, and the price is currently moving above the daily SMA200. However, based on the RSI and other indicators, a pullback toward the support level at $0.4007 is possible. In any case, in the event of a breakout above the resistance zone, the targets are:
🎯 $0.5791
🎯 $0.6587
🎯 $0.7719
🎯 $0.9162
⚠️ Always use a tight stop-loss and apply proper risk management.
🎯 $0.5791
🎯 $0.6587
🎯 $0.7719
🎯 $0.9162
⚠️ Always use a tight stop-loss and apply proper risk management.
Disclaimer
The information and publications are not meant to be, and do not constitute, financial, investment, trading, or other types of advice or recommendations supplied or endorsed by TradingView. Read more in the Terms of Use.
Disclaimer
The information and publications are not meant to be, and do not constitute, financial, investment, trading, or other types of advice or recommendations supplied or endorsed by TradingView. Read more in the Terms of Use.