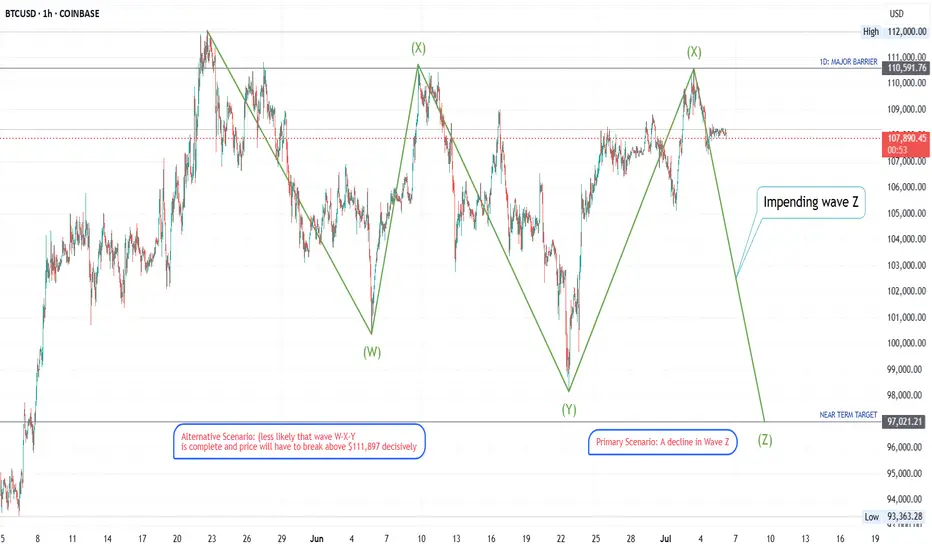
The price action on this BTC chart displays the characteristics of an overlapping, sideways, and downward-drifting nature of the price swings strongly indicates a complex corrective pattern. The most fitting pattern is a Triple Three, denoted as W-X-Y-X-Z. This is an extended consolidation pattern composed of three simpler corrections (W, Y, and Z) linked by two intervening waves (X).
Most Probable Next Moves
Based on the identification of the market being at the end of a second Wave X, the following are the most probable scenarios:
Primary Scenario: A Decline in Wave Z
The highest probability path is a decline in Wave Z.
Immediate Move: The price is expected to turn down from the current resistance area (the peak of the second Wave X, roughly $110,600).
Structure of the Move: Wave Z will itself be a corrective pattern, most likely another zig-zag (structured as A-B-C down).
Price Target: A common characteristic of a Triple Three is that Wave Z will often push to a new low for the entire structure. The chart's pre-marked "NEAR TERM TARGET" at $97,021 is a logical objective. This would involve breaking below the previous Wave Y low of $98,225.
Alternative Scenario (Less Likely)
A less probable scenario is that the entire W-X-Y correction completed at the June 23rd low. In this case, the rally since then would be the beginning of a new impulsive uptrend (Wave 1). This is considered less likely because the rally from late June to early July appears corrective and lacks the powerful, non-overlapping structure typical of a new impulse wave. For this scenario to gain credibility, the price would need to decisively break above the major barrier at $111,897.
Trade closed manually
This updates closes the short position as there is a change in structure of the declining Triple Three. Yesterday, there was a strong bullish candle breaking and closing above the top of the declining angle. This invalidates the Triple Three and so I have closed the position. The beauty of these structures is that you don't have to sit in losses too long. Minimize your losses and maximize your profits. That's the probability of trading. We have a double tops on BTC at the moment and so While the unlikely scenario is playing out, I will wait for a clear break and close above the $112k before joining the bulls. Cheers !Disclaimer
The information and publications are not meant to be, and do not constitute, financial, investment, trading, or other types of advice or recommendations supplied or endorsed by TradingView. Read more in the Terms of Use.
Disclaimer
The information and publications are not meant to be, and do not constitute, financial, investment, trading, or other types of advice or recommendations supplied or endorsed by TradingView. Read more in the Terms of Use.