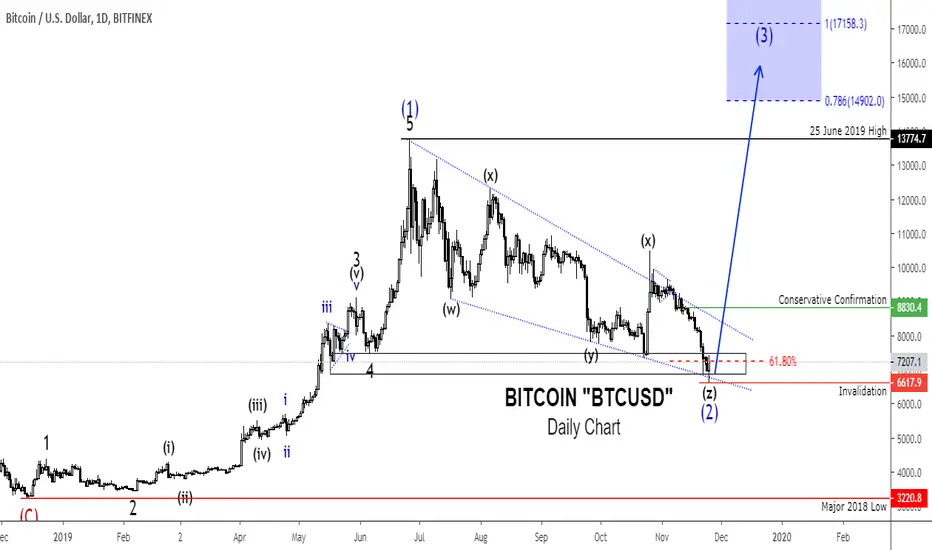
Bitcoin started the correction from $13774.7 on 25th, June 2019, and now it seems to have bottomed at $6617.9 area on 25th November 2019.
The retracement lasted for five months and seemed to end on the exact day in November, "25th." So crazy how market work.
The corrective wave which unfolded has double three zigzag seemed to have found a bottom at $6617.9 critical support circa. The zone was comprising the low of the previous fourth wave at one & two lesser degree, 61.8 Fibonacci retracement of the advance from $3220.8, and fourth bounce of descending wedge support.
Today's also mark the first day we see a strong bullish rejection candle coming off the critical demand zone. So it's highly probable time to get in if you're considering investing or trade Bitcoin or other cryptos since Bitcoin is their primary price driver.
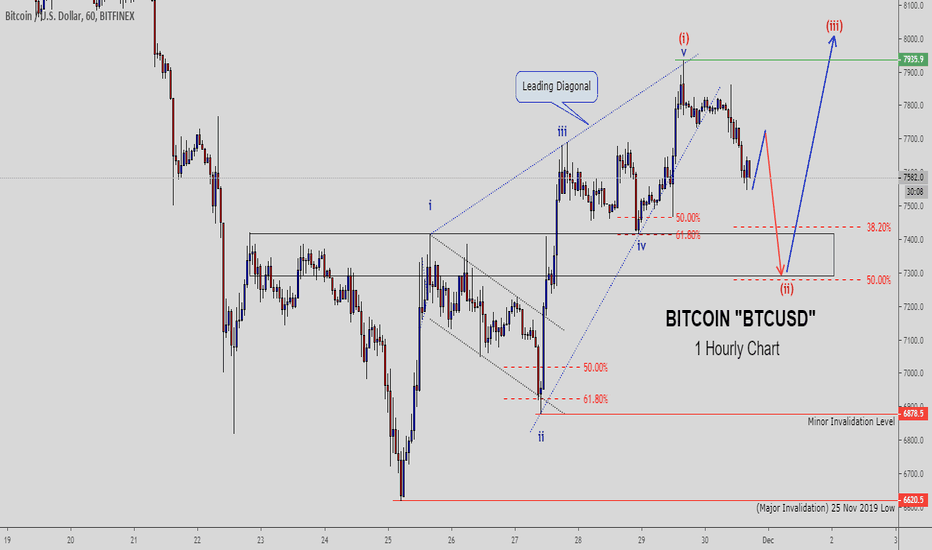
Checking to see if we see impulse move on lower timeframe:

So from yesterday's low, bitcoin rose in five-wave impulse, and according to EW theory, impulse determines the direction of the market and follows by three-wave correction. The retracement which seems not completed yet due to the shallow structure, I'm expecting the correction to reach 50% Fib area before the rally resumes. Yesterday's low must be held to believe we had a bottomed indeed.
If this wave count is correct, we should anticipate a rally from or near the current level and advance towards the resistance with 0.786 and 1.0 Fibonacci extension, as indicated on the chart.
Best of luck on the chart!
Veejahbee.
The retracement lasted for five months and seemed to end on the exact day in November, "25th." So crazy how market work.
The corrective wave which unfolded has double three zigzag seemed to have found a bottom at $6617.9 critical support circa. The zone was comprising the low of the previous fourth wave at one & two lesser degree, 61.8 Fibonacci retracement of the advance from $3220.8, and fourth bounce of descending wedge support.
Today's also mark the first day we see a strong bullish rejection candle coming off the critical demand zone. So it's highly probable time to get in if you're considering investing or trade Bitcoin or other cryptos since Bitcoin is their primary price driver.
Checking to see if we see impulse move on lower timeframe:
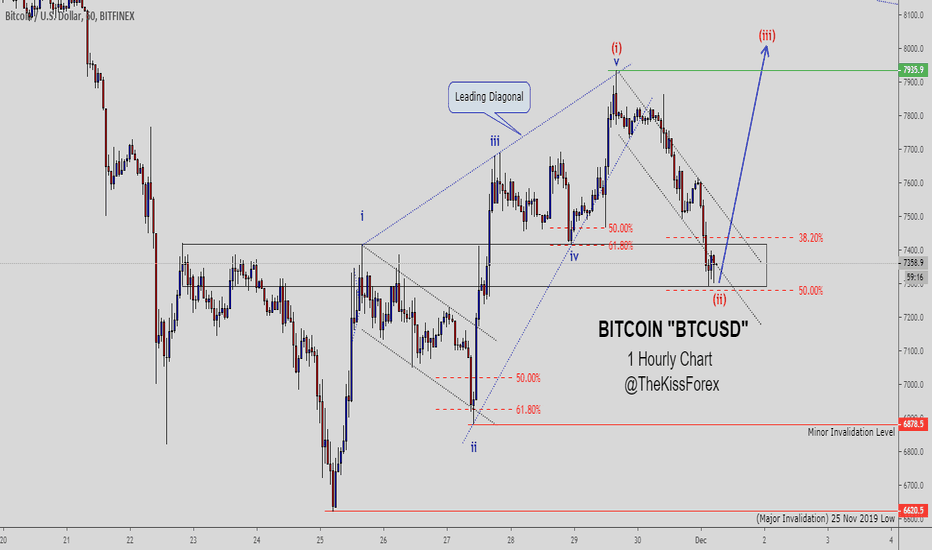
So from yesterday's low, bitcoin rose in five-wave impulse, and according to EW theory, impulse determines the direction of the market and follows by three-wave correction. The retracement which seems not completed yet due to the shallow structure, I'm expecting the correction to reach 50% Fib area before the rally resumes. Yesterday's low must be held to believe we had a bottomed indeed.
If this wave count is correct, we should anticipate a rally from or near the current level and advance towards the resistance with 0.786 and 1.0 Fibonacci extension, as indicated on the chart.
Best of luck on the chart!
Veejahbee.
Note
The BTCUSD "Bitcoin" price has completed a 5-3 wave cycle. Price should resume wave ((3)) advance and should locate resistance within $8300 area (within the blue box or above).Note
Here is a new update:Bitcoin finds buyers again at $6878 area, the correction structure became complex and unfolded as a triple three pattern.
Now we have another key level on the chart ($6878), which must stay intact while price advance higher to make wave ((3)) of 1.
Note
Update:Bitcoin is now setting the stage for wave 3 of (3) of ((3)) advance.
A significant rally should commence once the current correction is completed. I'm projecting that the upper trendline will accumulate sellers and signal the completion of wave ((3)).
Note
Last leg before the advance.. You will want to set a buy stop order because buy limit order has the way of not getting filled and you will be frustrated if you missed the move.Here is how you set a buy stop order above the current price.
Note
Here is what's happening on BTC. The corrective wave 2 is becoming more complex, and It's unfolding as an EW regular FLAT pattern. Guess what will happen after the completion? It will send BITCOIN price higher sharply, at least to $8300 area. The KEY LEVEL for the bulls/buyers to hold remains 7241.7
Note
The price of bitcoin is making a series of 1-2, (1)-(2) pattern and as well it's broken and retesting a significant supply and demand zone. This is an indication of an extremely bullish market. Buyers/Investors to look for buy from subsequent Higher Lows. Our current Key Level that must hold buyers is $7461 and potential buying area is now or a dip to $7700 will give another cheap entry.
Note
Our Mid-term target is within $8400 and $8500 area.Note
Note
Note
We should be anticipating a strong demand at $7100 - $7000 area. A simple zigzag is in the making and almost completed.
The confluence level at $7100 is very critical for sellers!
Disclaimer
The information and publications are not meant to be, and do not constitute, financial, investment, trading, or other types of advice or recommendations supplied or endorsed by TradingView. Read more in the Terms of Use.
Disclaimer
The information and publications are not meant to be, and do not constitute, financial, investment, trading, or other types of advice or recommendations supplied or endorsed by TradingView. Read more in the Terms of Use.