From the chart provided (BTC/USD on the 15-minute timeframe), here are the **key points** and notable observations:
---
🔑 **Key Technical Points:**
1. **Price Level**:
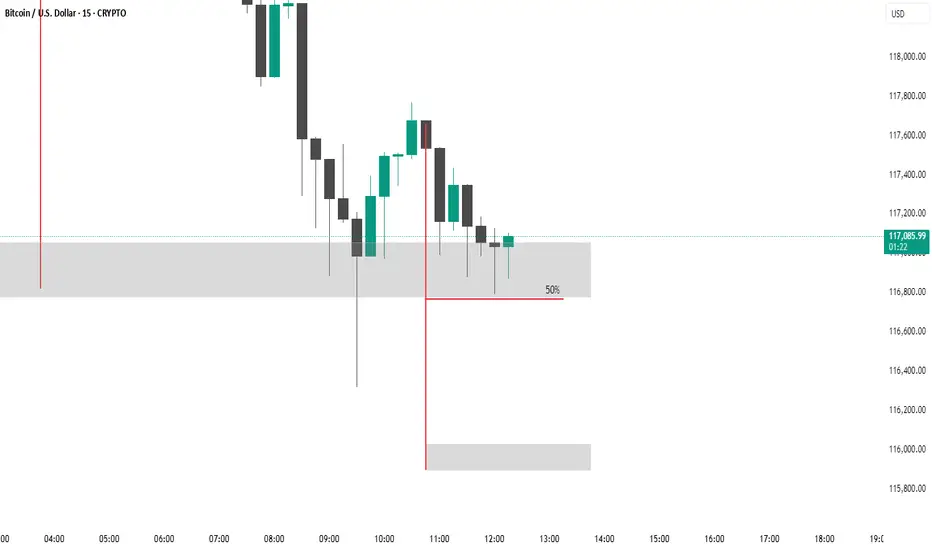
* Current price: **\$116,942.23**
2. **Supply/Demand Zones**:
* **Supply Zone (Resistance)**: Gray zone near the **\$117,000** level
Price entered this zone and rejected, indicating selling pressure.
* **Demand Zone (Support)**: Lower gray zone around **\$115,900–\$116,100**
This area may act as a bounce point if price drops further.
3. **50% Level**:
* A red horizontal line is marked at **50% of the last impulse leg**, just above **\$116,800**.
This is likely used as a **midpoint retracement** zone and is acting as resistance.
4. **Bearish Candlestick Structure**:
* Series of lower highs and lower lows after the price failed to break the resistance area.
* Momentum appears to be favoring the downside.
5. **Liquidity Sweep**:
* A long wick can be seen below \$116,800, indicating a **liquidity grab** before a bounce.
* This often signals stop-hunting activity.
---
📉 **Potential Scenarios:**
* **Bearish Bias**: If price continues below \$116,800 (50% level), it could target the demand zone near **\$116,000**.
* **Bullish Rejection**: If price bounces sharply from the current gray zone, watch for a re-test of the **\$117,200+** area.
---
thanking u
---
🔑 **Key Technical Points:**
1. **Price Level**:
* Current price: **\$116,942.23**
2. **Supply/Demand Zones**:
* **Supply Zone (Resistance)**: Gray zone near the **\$117,000** level
Price entered this zone and rejected, indicating selling pressure.
* **Demand Zone (Support)**: Lower gray zone around **\$115,900–\$116,100**
This area may act as a bounce point if price drops further.
3. **50% Level**:
* A red horizontal line is marked at **50% of the last impulse leg**, just above **\$116,800**.
This is likely used as a **midpoint retracement** zone and is acting as resistance.
4. **Bearish Candlestick Structure**:
* Series of lower highs and lower lows after the price failed to break the resistance area.
* Momentum appears to be favoring the downside.
5. **Liquidity Sweep**:
* A long wick can be seen below \$116,800, indicating a **liquidity grab** before a bounce.
* This often signals stop-hunting activity.
---
📉 **Potential Scenarios:**
* **Bearish Bias**: If price continues below \$116,800 (50% level), it could target the demand zone near **\$116,000**.
* **Bullish Rejection**: If price bounces sharply from the current gray zone, watch for a re-test of the **\$117,200+** area.
---
thanking u
Disclaimer
The information and publications are not meant to be, and do not constitute, financial, investment, trading, or other types of advice or recommendations supplied or endorsed by TradingView. Read more in the Terms of Use.
Disclaimer
The information and publications are not meant to be, and do not constitute, financial, investment, trading, or other types of advice or recommendations supplied or endorsed by TradingView. Read more in the Terms of Use.