Hello fellow Traders.
I am long, only posting my target area.
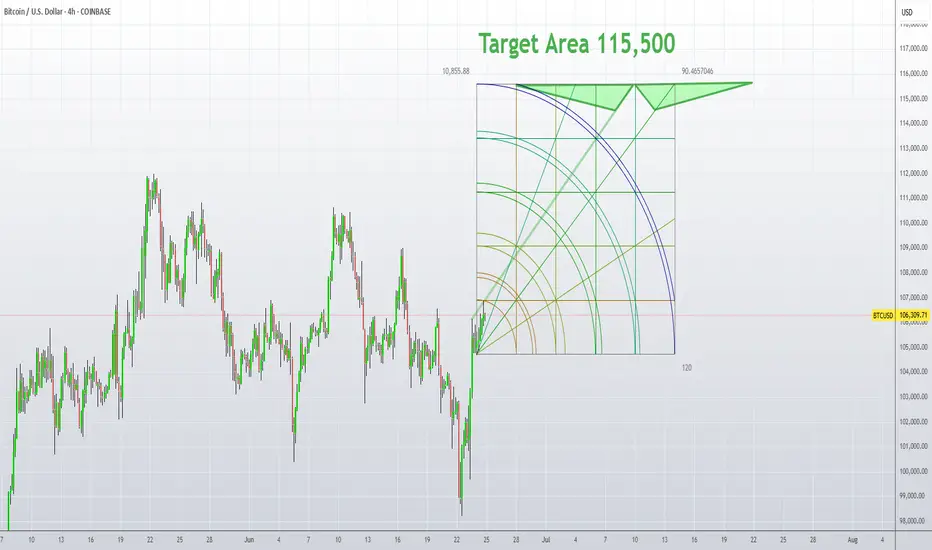
This Chart is very clean.
I came to the target conclusion area, with some Math, and I have used a Gann Square to monitor a time frame to reach the target area.
Yes, your reading it correctly, seems like it can happen as early as this Friday, and as late as July 22.
PA doesn't necessarily have to stay in the positive area of this Gann Square, and has all the right to swing back up inside positive, to finish it's goal.
The Plan:
The probability to reach the target within the time frame will fade slowly out, far past the Gann Square.
Yes, I am actually guessing where the nearest chance to reach this price level is going to happen "if it will happen" within the green target area, so I may close out my long trade somewhere along the way up. Afterwards scalp the box up and down till it hits the Target Area.
Except price to have an extremely high chance to bounce down from the Target Area, when it hits.
Good Luck !!
I am long, only posting my target area.
This Chart is very clean.
I came to the target conclusion area, with some Math, and I have used a Gann Square to monitor a time frame to reach the target area.
Yes, your reading it correctly, seems like it can happen as early as this Friday, and as late as July 22.
PA doesn't necessarily have to stay in the positive area of this Gann Square, and has all the right to swing back up inside positive, to finish it's goal.
The Plan:
The probability to reach the target within the time frame will fade slowly out, far past the Gann Square.
Yes, I am actually guessing where the nearest chance to reach this price level is going to happen "if it will happen" within the green target area, so I may close out my long trade somewhere along the way up. Afterwards scalp the box up and down till it hits the Target Area.
Except price to have an extremely high chance to bounce down from the Target Area, when it hits.
Good Luck !!
Trade active
Lots of pressure is building for the downside, however the strength that the indicators are holding onto currently, has been yielding a steady march upwards. The Bears are failing to take over.It's very touchy as BTC dominance has an edge currently and is causing extra BTC pumping and most of the alt market coins are slowly loosing ground. The market is all BTC for the near term. In general... alts directly tied to BTC, will not see the extreme % numbers to the downside, if compared to the other alts that are tied to ETH.
Note
Sold My initial Long I already had when I made this chart.. Then Went short, and recently exited that trade.Now ?
I am Considering a Long . Confirmation might take a few days. We are close to the "temporary near-term" bottom.
Note
I think it is a higher probability that we are "approaching" a "top area" and PA is preparing for the next bottom.Always respect Bitcoin as it generally has way more power going up then down, and entering a short trade we are subjected to: I do bias think, that more bull strength shows up more often than bear strength.
However ... Here's a possible upcoming Short Set-up ..
I have pictured the 1-hour and 4-hour charts for our comparison. This set-up can/could/might take a 1 hour or 10 hours to form up and move south. After 8 hours if the move isn't forming then the momentum/volatility is slightly elevated then an addition few 4-hour bars necessary to confirm PA's future momentum direction. (which could be a further bullish momentum pulse, "less likely").
Does it matter that the PA bars are hard to see with all the chart info...? NO
Does it matter about the names of indicators..? not really
It matters to compare a possible future move with these indicators.
1-hour and 4-hour indicators are all in alignment.
These Indicators are a lagging market view.
MACd
RSI w/stoch and money factor
a few other complex momentum indicators
Use your chart and monitor an exit for an existing Long or new Short entry.
1-hour
1-hour
4-hour
4-hour
Good Luck
Note
PA has entered into another Bullish price level, that has increased the potential that PA, "slightly dips" and continues an uptrend. However... "this zone is the resistance zone"Well PA could go into the 104k price levels, 105k price levels might be a goal for profit on an upcoming short.
Take our time, timing the entry. A few more hours is what I will wait for regardless of what PA does now.
4-hour chart showing ... using this Gann Square
Note
The trade went well. This SHORT got 1.96%, I couldn't hold out to see if it would hit my target. PA was not lurching towards my final target, .... I pulled in my stop closer, and got stopped out....
Even thou it is America's Independence Day and weekend. I will begin to study for the long set-up, There might be more downside, I don't know I only planned for this move.
Good Luck
Note
With the weekend uncertainty of trader participation, I will be very cautious, It is Friday July 4th, Long summer weekend. Near-term: Outlook after the trade is over.
The indicators on the:
4-hour still call for more downside pressures.
1-hour at exhaustion levels ... slowing slide angle, maybe looking to provide upward pressures.
15-min .. visually looks like its ready to start an entire upward trend.
(3-hour & 4-hour) these guys are in the middle of their downward cycle seeking the zero line or sub-zero zones.
This kind of Time Frame extreme pressure differences will hamper the smaller time frames progression...however it can be extremely additive when pressures align together.
I think sideways with downside pressures mostly for a while. (PA could/maybe drop another $1,500 or ~~ 1.4%)
Now...PA could do an extreme dip (over minus -2.5%). PA would then trade lower than the visual graphic.
This upcoming dip has an unknown pulse flex for depth. The 4-hour indicator will provide power for a move upwards after this is finished. For now: 8-hours to 3-days and "rarely up to 5 - 7 days extended".
However visually on the Gann Square it looks like it found a great place to bounce off of.
Here's the backed out view of the GANN SQUARE where I am trading Longs and Shorts using the Gann Square as an addition tool/layout.
Note
Disclaimer
The information and publications are not meant to be, and do not constitute, financial, investment, trading, or other types of advice or recommendations supplied or endorsed by TradingView. Read more in the Terms of Use.
Disclaimer
The information and publications are not meant to be, and do not constitute, financial, investment, trading, or other types of advice or recommendations supplied or endorsed by TradingView. Read more in the Terms of Use.