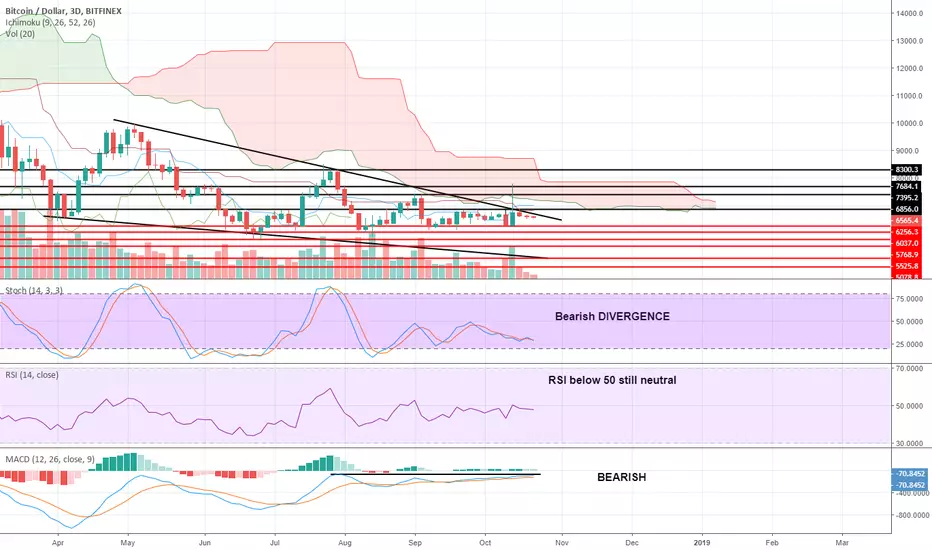
BTC is situated into a falling wedge from 28 april 2018.This Falling wedge is a reversal pattern so in the final we will have a breakout!.
If we are watching this chart in 4 may 2018 they made a TOP at 99xx and after they made lower highs like:
-30 july 8300$,
-4 sept 7400$
-16 oct 68xx$
When the market makes lower highs it s a clear sign of bearish.
What about indicators?
-Stoch:we have a bearish divergence here at 3D timeframe becouse the bull line is below orange line
-RSI:neutral
-MACD:it s a little intresting becouse MACD is still growing slowly but the price didn t move(bearish sign),last time when MACD was here the price are above 8300$ and also is sub neutral zone(0) which also confirm bearish.
-We are near resistance line of this falling wedge and above we have ichimoku cloud which is also a strong resistance at 3D timeframe
-Volume is less ,with this volume i m sure 100% we can t breakout
-CME(bullish) contracts expire in 3 days(26 oct) and after once again will be turned bearish
-BAKKT is postponed to 12 december(i think we need to touch 4,8k in this case we don t need bullish movements/news in market)
We are near to a big movement personally i don t make trades on bitmex now just i m waiting..it s really gamble at the moment becouse can be a shakeout to 7400$ to hit ichimoku resistance and after will be the capitulate phase which made part of every market cycle
IF WE DON T BROKE 7450$ WE ARE BEARISH KEEP THIS IN MIND,don t forget we need to capitulate,but when???
3D resistance:
-6856$
-7200-7888$ ichimoku resistance
-7395$
-7684$
-8300$
3D supports:
-6256
-6037
-5768
-5525
-5078
Disclaimer
The information and publications are not meant to be, and do not constitute, financial, investment, trading, or other types of advice or recommendations supplied or endorsed by TradingView. Read more in the Terms of Use.
Disclaimer
The information and publications are not meant to be, and do not constitute, financial, investment, trading, or other types of advice or recommendations supplied or endorsed by TradingView. Read more in the Terms of Use.