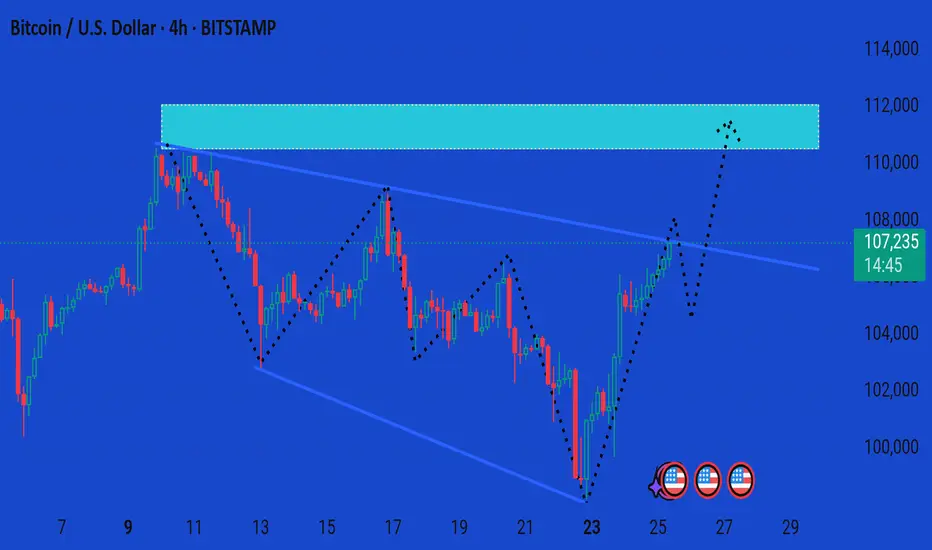
This chart is a Bitcoin (BTC/USD) analysis on the 4-hour timeframe, and it reflects a bullish breakout scenario. Let’s break down the structure:
---
Current Status:
Price: $107,201
Change: +1,070 (+1.01%)
---
Chart Structure & Key Zones:
Descending Wedge Formation:
Price has been trading within a falling wedge (a bullish reversal pattern), and has now broken out to the upside.
Key Resistance Zone (Light Blue Box):
Target area lies between $110,500 – $112,000, marked as the potential take-profit/supply zone.
Dotted Path Projection:
Implies a short-term bullish move continuing upward post-breakout, toward the blue resistance zone.
---
Analysis & Interpretation:
Bullish Bias Confirmed:
The breakout from the wedge pattern adds strength to the bullish outlook.
Next Steps:
A retest of the breakout level (around $105,000–$106,000) may occur before continuation.
Upon successful retest or sustained momentum, the price could surge toward $112,000.
Resistance Reaction Expected:
Watch for selling pressure or reversal patterns near the blue zone.
---
Summary:
Pattern: Falling Wedge (bullish breakout)
Immediate Support: ~$105,000
Immediate Resistance Target: $110,500–$112,000
Bias: Bullish continuation, with potential for mid-term profit-taking near the resistance zone.
---
Would you like exact entry, stop-loss, and take-profit levels based on this breakout?
---
Current Status:
Price: $107,201
Change: +1,070 (+1.01%)
---
Chart Structure & Key Zones:
Descending Wedge Formation:
Price has been trading within a falling wedge (a bullish reversal pattern), and has now broken out to the upside.
Key Resistance Zone (Light Blue Box):
Target area lies between $110,500 – $112,000, marked as the potential take-profit/supply zone.
Dotted Path Projection:
Implies a short-term bullish move continuing upward post-breakout, toward the blue resistance zone.
---
Analysis & Interpretation:
Bullish Bias Confirmed:
The breakout from the wedge pattern adds strength to the bullish outlook.
Next Steps:
A retest of the breakout level (around $105,000–$106,000) may occur before continuation.
Upon successful retest or sustained momentum, the price could surge toward $112,000.
Resistance Reaction Expected:
Watch for selling pressure or reversal patterns near the blue zone.
---
Summary:
Pattern: Falling Wedge (bullish breakout)
Immediate Support: ~$105,000
Immediate Resistance Target: $110,500–$112,000
Bias: Bullish continuation, with potential for mid-term profit-taking near the resistance zone.
---
Would you like exact entry, stop-loss, and take-profit levels based on this breakout?
Disclaimer
The information and publications are not meant to be, and do not constitute, financial, investment, trading, or other types of advice or recommendations supplied or endorsed by TradingView. Read more in the Terms of Use.
Disclaimer
The information and publications are not meant to be, and do not constitute, financial, investment, trading, or other types of advice or recommendations supplied or endorsed by TradingView. Read more in the Terms of Use.