Key Observations
Channel Pattern & Elliott Wave Count:
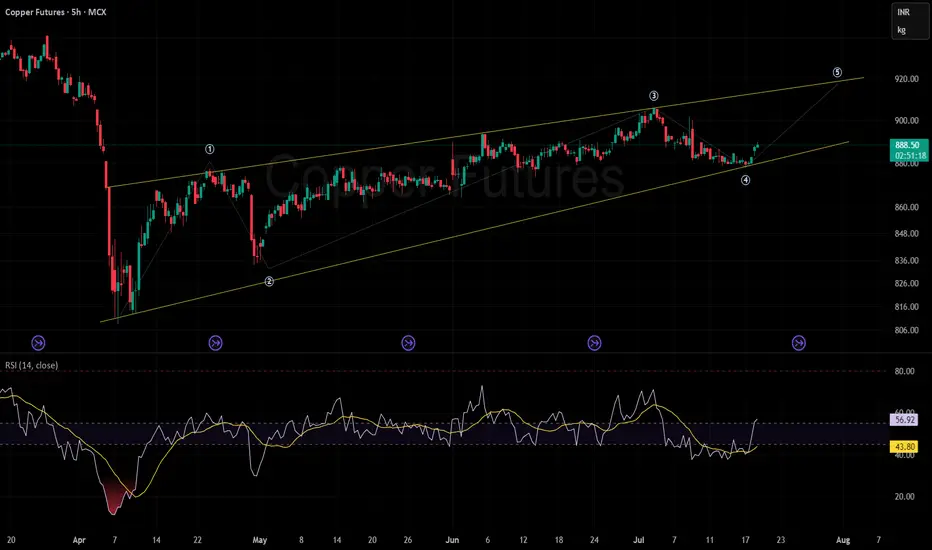
Price action is moving within a well-defined upward-sloping channel (yellow lines).
An Elliott Wave structure is marked (① to ⑤). The price just completed wave ④, suggesting the next move may attempt to form wave ⑤ towards the upper channel boundary, targeting roughly the 920 level.
Price Support & Resistance:
Support: The lower channel boundary, recently tested during the wave ④ dip (~880 area), acts as a dynamic support.
Resistance: The upper channel line, which coincides with the projected wave ⑤, serves as resistance near 920.
RSI & Momentum:
The Relative Strength Index (RSI) at the bottom oscillates between 43.81 (current), with a recent bounce upward.
The yellow MA of RSI is at 57.07, showing the RSI is crossing its MA from below, which is typically a bullish signal.
RSI is neither overbought nor oversold, offering room for upward movement if momentum sustains.
Trend Context:
The overall trend is upward within the channel.
Recent price action after the wave ④ low suggests a renewed attempt at bullish momentum.
Summary & Implications:
The chart implies a bullish bias as long as the lower channel (support) holds. There is a technical setup for a move toward the upper trendline and wave ⑤ target (~920).
Watch for price reactions near the lower channel support—if broken, it would invalidate the immediate bullish thesis.
RSI is supportive of further upside, but needs confirmation from increasing volume and a sustained move above the 890 mark.
Channel Pattern & Elliott Wave Count:
Price action is moving within a well-defined upward-sloping channel (yellow lines).
An Elliott Wave structure is marked (① to ⑤). The price just completed wave ④, suggesting the next move may attempt to form wave ⑤ towards the upper channel boundary, targeting roughly the 920 level.
Price Support & Resistance:
Support: The lower channel boundary, recently tested during the wave ④ dip (~880 area), acts as a dynamic support.
Resistance: The upper channel line, which coincides with the projected wave ⑤, serves as resistance near 920.
RSI & Momentum:
The Relative Strength Index (RSI) at the bottom oscillates between 43.81 (current), with a recent bounce upward.
The yellow MA of RSI is at 57.07, showing the RSI is crossing its MA from below, which is typically a bullish signal.
RSI is neither overbought nor oversold, offering room for upward movement if momentum sustains.
Trend Context:
The overall trend is upward within the channel.
Recent price action after the wave ④ low suggests a renewed attempt at bullish momentum.
Summary & Implications:
The chart implies a bullish bias as long as the lower channel (support) holds. There is a technical setup for a move toward the upper trendline and wave ⑤ target (~920).
Watch for price reactions near the lower channel support—if broken, it would invalidate the immediate bullish thesis.
RSI is supportive of further upside, but needs confirmation from increasing volume and a sustained move above the 890 mark.
Disclaimer
The information and publications are not meant to be, and do not constitute, financial, investment, trading, or other types of advice or recommendations supplied or endorsed by TradingView. Read more in the Terms of Use.
Disclaimer
The information and publications are not meant to be, and do not constitute, financial, investment, trading, or other types of advice or recommendations supplied or endorsed by TradingView. Read more in the Terms of Use.