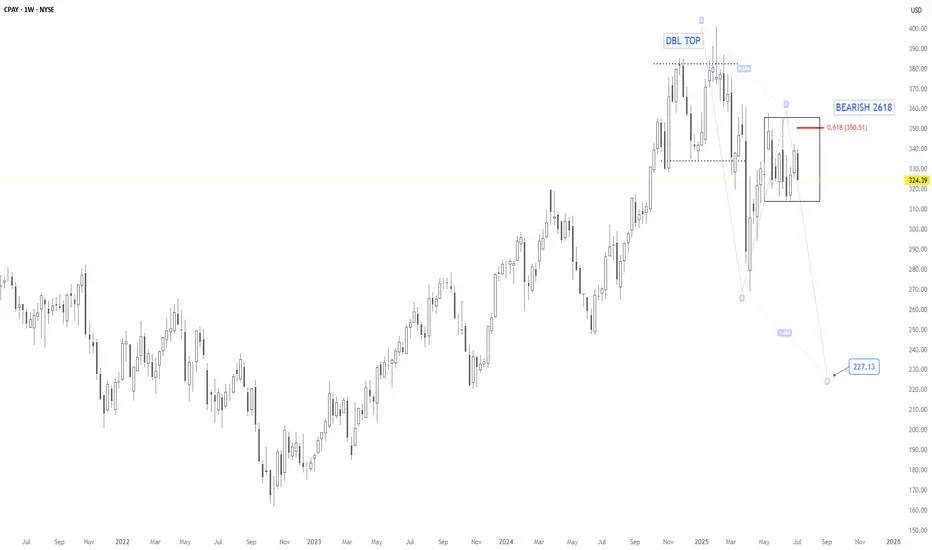
Weekly chart confirms a Technical Double Top pattern around $370–$380, followed by a textbook Bearish 2618 retracement.
🔍 Key Confluences:
- Double Top confirmed, neckline broken.
- Price retested 0.618 Fib retracement at $350.51 (aligning with weekly resistance).
- Bearish 2618 pattern projects downside potential toward $227.13.
First support to watch: $313.97, followed by $269.02.
🧭 Bearish outlook favored unless weekly close reclaims $355+. As long as price stays below that level, sellers remain in control.
Harmonic Patterns | Market Analyst | Forex Analytix | Porto, Portugal
Related publications
Disclaimer
The information and publications are not meant to be, and do not constitute, financial, investment, trading, or other types of advice or recommendations supplied or endorsed by TradingView. Read more in the Terms of Use.