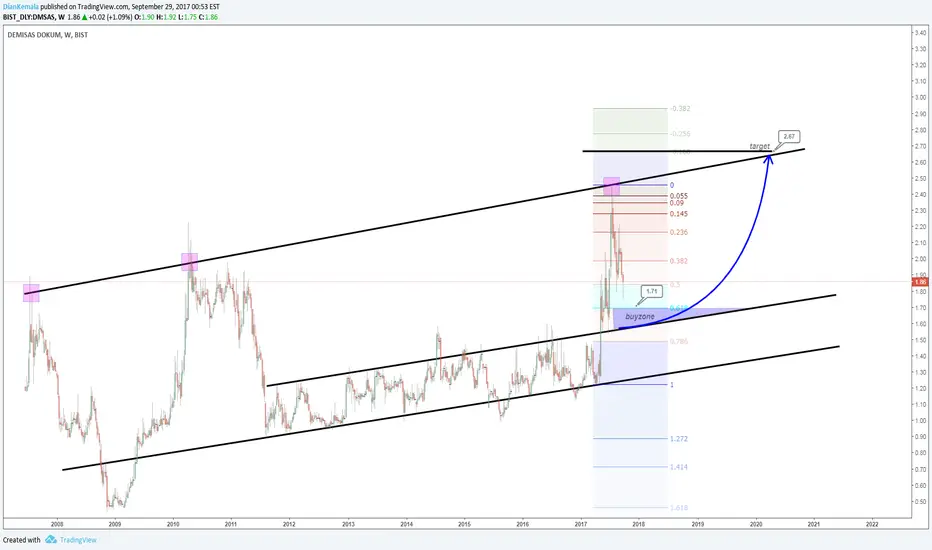
DEMISAS DOKUM down after hit triple top at weekly chart.
this is correction to 618 fibonacci retracement around 1.71
we can follow bullish from this point to aim 2.67 as fibonacci projection at resistance trendline
this is correction to 618 fibonacci retracement around 1.71
we can follow bullish from this point to aim 2.67 as fibonacci projection at resistance trendline
Disclaimer
The information and publications are not meant to be, and do not constitute, financial, investment, trading, or other types of advice or recommendations supplied or endorsed by TradingView. Read more in the Terms of Use.
Disclaimer
The information and publications are not meant to be, and do not constitute, financial, investment, trading, or other types of advice or recommendations supplied or endorsed by TradingView. Read more in the Terms of Use.