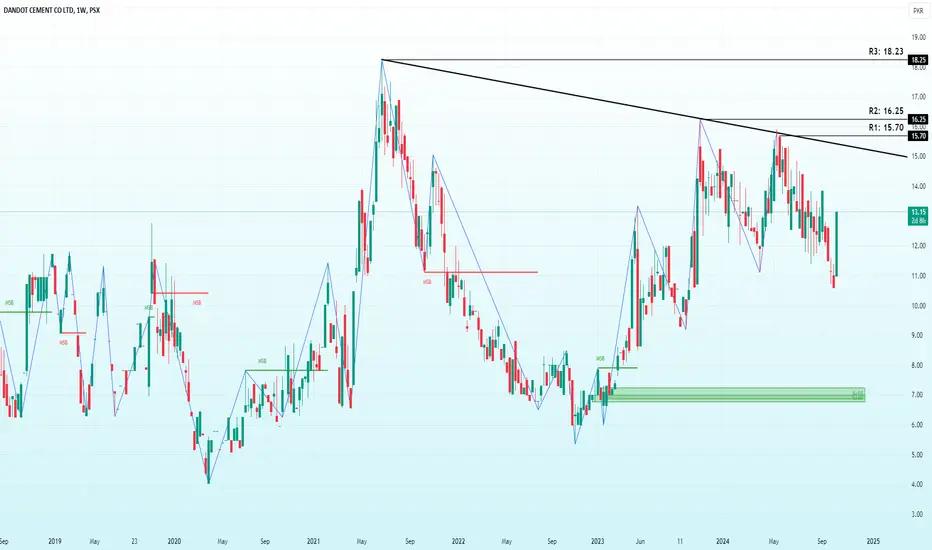
The weekly chart of Dandot Cement (DNCC) shows a recent 19.55% surge, closing at PKR 13.15. The stock is approaching resistance levels at PKR 15.70 (R1), PKR 16.25 (R2), and PKR 18.23 (R3), with a descending trendline acting as overhead resistance. A breakout above R1 could push the price higher toward R2 and R3. The support zone around PKR 6.00 indicates strong buyer interest, making it a good risk-reward setup. A long position could be considered above R1 (15.70), with a stop loss near PKR 11.
Disclaimer
The information and publications are not meant to be, and do not constitute, financial, investment, trading, or other types of advice or recommendations supplied or endorsed by TradingView. Read more in the Terms of Use.
Disclaimer
The information and publications are not meant to be, and do not constitute, financial, investment, trading, or other types of advice or recommendations supplied or endorsed by TradingView. Read more in the Terms of Use.