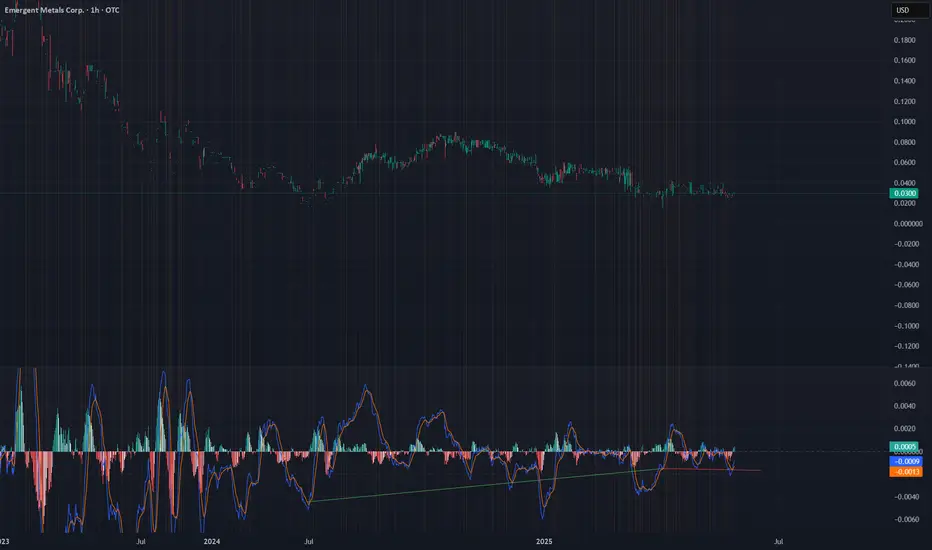
Could be reaching with this one...OTC, BUT it popped on the screener as one that has clear indications of a bottom. On this daily chart, we see clear bullish divergence formed over a long period of time, and continuing through the last poke lower. What I really like, as illustrated by the red line in MACD on the currently forming higher low is the hidden bullish divergence, which in my analysis acts as a confirmation that the bottom is in. When I look at a wave 2, I like to see MACD more extreme, lower in this case, than the presumptive low.
Trade active
Bought 12,500 @ .03Disclaimer
The information and publications are not meant to be, and do not constitute, financial, investment, trading, or other types of advice or recommendations supplied or endorsed by TradingView. Read more in the Terms of Use.
Disclaimer
The information and publications are not meant to be, and do not constitute, financial, investment, trading, or other types of advice or recommendations supplied or endorsed by TradingView. Read more in the Terms of Use.