When markets go quiet and churn sideways, it’s easy to get lost in the noise. But inside that congestion lies opportunity — if you understand the difference between "Congestion Action" and "Congestion Exit." Here’s how to apply Drummond Geometry to trade these phases with precision:
🔹 Congestion Action
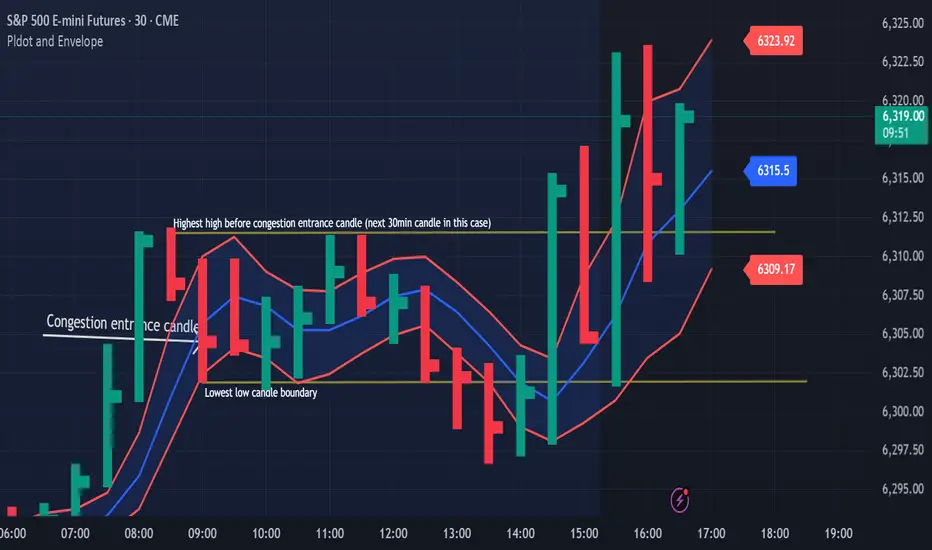
Congestion action is when the market is not ready to trend — it's swinging back and forth within a defined range, between a strong block level and a well-established dotted line. Think of it as a "resting zone" before the next directional move.
📏 Original Confines: Highest high and lowest low after a congestion entrance as shown on the chart
🚧 Expanded Confines: Price temporarily breaks out of the range but doesn’t establish a trend (3 closes on the came side of the PLdot (blue line)).
🧲 This is where scalpers and range traders thrive. Look for setups near envelope confines and use nearby energy fields.
✅ Trade Plan: Play the range — buy support, sell resistance — until proven otherwise.
🔸 Congestion Exit
This is when the market transitions from ranging to trending — a trend run begins from within the congestion zone.
🚀 First bar of a new trend closes outside the congestion confines (either the block level (highest high on the chart) or the dotted line (the low on the chart)).
📊 The next bar must confirm with a trend run close — if not, it’s a failed breakout. You can see on the chart that price tried to trend lower but the trend was not confirmed!
⚡ Patterns to watch:
Energy pushing in the direction of the exit (PL Dot push, c-wave continuation).
6-1 lines against the breakout direction disappear.(Not visible in this version)
Resistance/support against the exit breaks.
✅ Trade Plan: Enter on breakout confirmation, not just the breakout bar. Measure energy and watch the follow-through.
🧭 Tip:
Don't get faked out. If price re-enters congestion after a breakout, re-draw the boundaries — the old congestion is no longer valid.
🔥 Bottom Line:
Congestion Action is where the market breathes. Congestion Exit is where it moves. Mastering the handoff between the two gives you a decisive edge.
🔹 Congestion Action
Congestion action is when the market is not ready to trend — it's swinging back and forth within a defined range, between a strong block level and a well-established dotted line. Think of it as a "resting zone" before the next directional move.
📏 Original Confines: Highest high and lowest low after a congestion entrance as shown on the chart
🚧 Expanded Confines: Price temporarily breaks out of the range but doesn’t establish a trend (3 closes on the came side of the PLdot (blue line)).
🧲 This is where scalpers and range traders thrive. Look for setups near envelope confines and use nearby energy fields.
✅ Trade Plan: Play the range — buy support, sell resistance — until proven otherwise.
🔸 Congestion Exit
This is when the market transitions from ranging to trending — a trend run begins from within the congestion zone.
🚀 First bar of a new trend closes outside the congestion confines (either the block level (highest high on the chart) or the dotted line (the low on the chart)).
📊 The next bar must confirm with a trend run close — if not, it’s a failed breakout. You can see on the chart that price tried to trend lower but the trend was not confirmed!
⚡ Patterns to watch:
Energy pushing in the direction of the exit (PL Dot push, c-wave continuation).
6-1 lines against the breakout direction disappear.(Not visible in this version)
Resistance/support against the exit breaks.
✅ Trade Plan: Enter on breakout confirmation, not just the breakout bar. Measure energy and watch the follow-through.
🧭 Tip:
Don't get faked out. If price re-enters congestion after a breakout, re-draw the boundaries — the old congestion is no longer valid.
🔥 Bottom Line:
Congestion Action is where the market breathes. Congestion Exit is where it moves. Mastering the handoff between the two gives you a decisive edge.
Disclaimer
The information and publications are not meant to be, and do not constitute, financial, investment, trading, or other types of advice or recommendations supplied or endorsed by TradingView. Read more in the Terms of Use.
Disclaimer
The information and publications are not meant to be, and do not constitute, financial, investment, trading, or other types of advice or recommendations supplied or endorsed by TradingView. Read more in the Terms of Use.