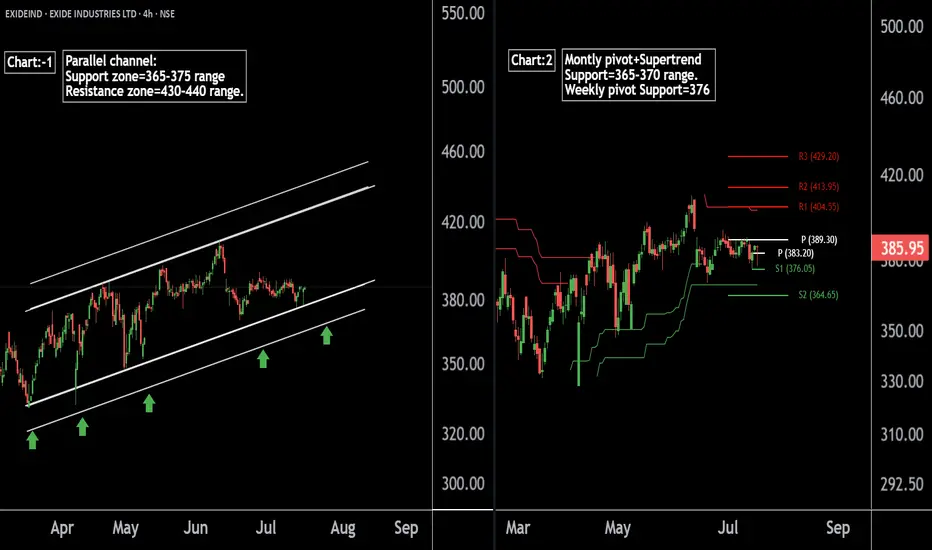
there are two chart of Exide Industries.
In a first chart: EXIDEIND is moving in a well defined parallel channel and currently trading near at support 365-375 range
In the second chart,EXIDEIND is respecting support at both the monthly pivot and the supertrend indicator, with the support zone positioned between ₹365-₹370.
EXIDEIND is currently sustaining below both the monthly and weekly pivot levels at ₹290. As long as the stock does not break above this pivot zone, the momentum is expected to remain weak.
If this level is suatin then ,we may see higher prices in EXIDEIND.
Thank you !!
Note
The monthly and weekly pivot level is ₹390, not ₹290 — it was a typing error earlier. Apologies for the confusion.@RahulSaraoge
Connect us at t.me/Fivecirclesofficial
Connect us at t.me/Fivecirclesofficial
Disclaimer
The information and publications are not meant to be, and do not constitute, financial, investment, trading, or other types of advice or recommendations supplied or endorsed by TradingView. Read more in the Terms of Use.
@RahulSaraoge
Connect us at t.me/Fivecirclesofficial
Connect us at t.me/Fivecirclesofficial
Disclaimer
The information and publications are not meant to be, and do not constitute, financial, investment, trading, or other types of advice or recommendations supplied or endorsed by TradingView. Read more in the Terms of Use.