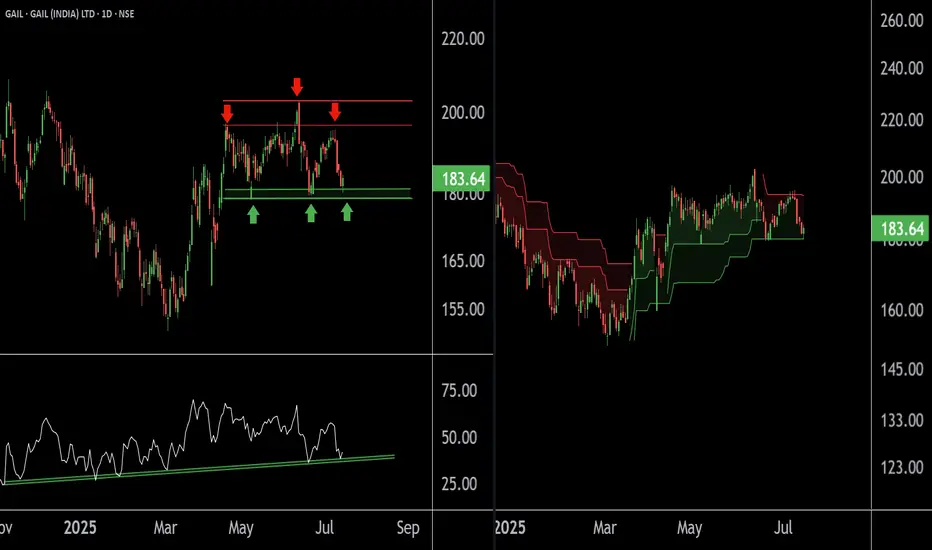
There are two chart of Gail on Daily timeframe.
On the first chart Gail is moving in well defined parallel channel with support near at 178-180 zone.
Daily RSI is also taking support and bouncing back, indicating a revival in short-term momentum and strengthening the overall bullish setup.
On the second chart , the stock is bouncing from the supertrend support around ₹180, reinforcing bullish sentiment. However, on the shorter timeframe, the supertrend indicator is acting as resistance near ₹192, which needs to be breached for further upside continuation.
Thank You !!
@RahulSaraoge
Connect us at t.me/Fivecirclesofficial
Connect us at t.me/Fivecirclesofficial
Disclaimer
The information and publications are not meant to be, and do not constitute, financial, investment, trading, or other types of advice or recommendations supplied or endorsed by TradingView. Read more in the Terms of Use.