The GBP/JPY lost its shine on board-based yen buying. It hit an intraday low of 197.01 and is currently trading around 197. Intraday trend is bearish as long as the resistance at 197.75 holds.
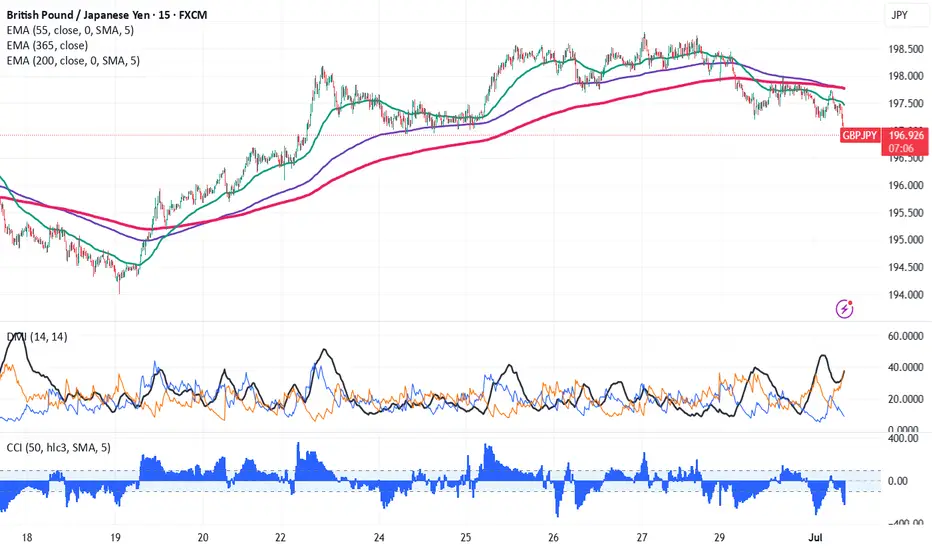
The GBP/JPY pair is trading below 34 and above 55 and 200 EMA (Short-term) and 365 EMA (long-term) on the 15-min chart, confirming a bearish trend. Any violation below 196.70 indicates the intraday trend is weak. A dip to 196/195/194/193.70 is possible. Immediate resistance is at 197.75 a breach above this level targets of 198.35/198.80/200/202.
Market Indicators (15 min chart)
CCI (50)- Bearish
Directional movement index - Bearish
Trading Strategy: buy on dips
It is good to sell on rallies around 197.18-20 with SL around 197.75 for a TP of 195.
Disclaimer
The information and publications are not meant to be, and do not constitute, financial, investment, trading, or other types of advice or recommendations supplied or endorsed by TradingView. Read more in the Terms of Use.
Disclaimer
The information and publications are not meant to be, and do not constitute, financial, investment, trading, or other types of advice or recommendations supplied or endorsed by TradingView. Read more in the Terms of Use.