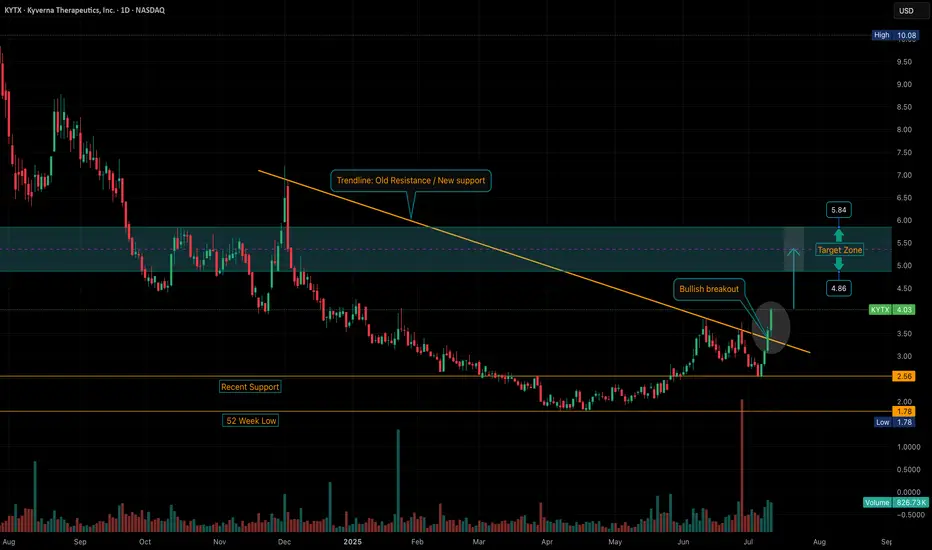
After months of consolidation at depressed levels, the setup finally resolved with conviction. The chart shows a clean break above long-standing trendline resistance (new support), after a bullish reversal off that $2.50 zone -- a level that’s now proven to be a meaningful pivot. July 11 marked the first close above $4 in quite some time, with above average volume confirming the move.
I’ve mapped out a target zone between $4.86 and $5.84 -- technically achievable based on prior supply zones and recent momentum. This aligns with H.C. Wainwright’s $5 PT, which frankly still feels conservative given the pipeline and float dynamics.
Chart speaks for itself. Let’s see how this plays out. Stay tuned!
Disclaimer
The information and publications are not meant to be, and do not constitute, financial, investment, trading, or other types of advice or recommendations supplied or endorsed by TradingView. Read more in the Terms of Use.
Disclaimer
The information and publications are not meant to be, and do not constitute, financial, investment, trading, or other types of advice or recommendations supplied or endorsed by TradingView. Read more in the Terms of Use.