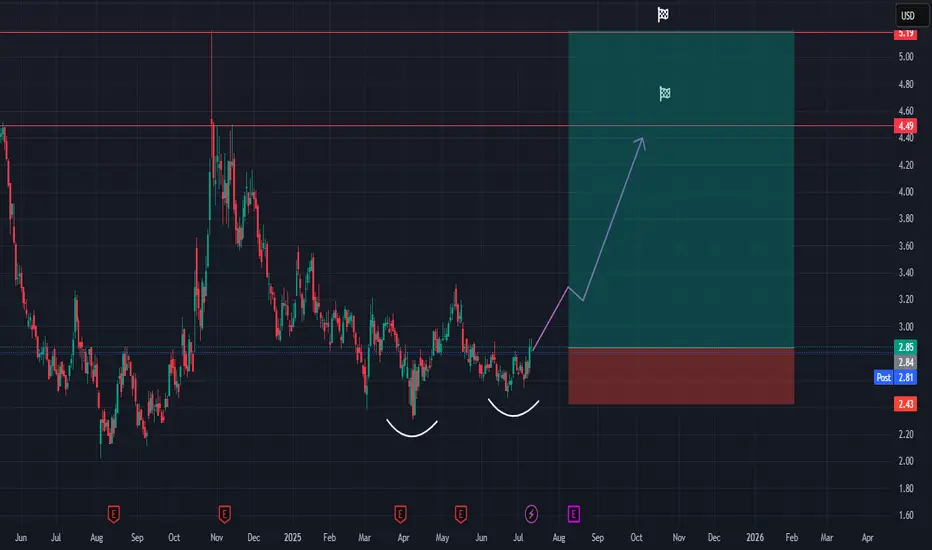
The LAC stock chart suggests a confirmed bottom structure, supported by a clear higher low pattern—a strong technical signal that downward momentum has likely ended and a trend reversal may be underway.
After an extended downtrend, the price has formed a rounded bottom with two notable troughs, indicating accumulation and base building. The most recent low is higher than the previous one, marking a bullish higher low, which strengthens the case for a trend reversal.
Key Technical Signals:
Confirmed bottom: Rounded bottom pattern over the past several months.
Higher low: Recent price action has respected prior support and pushed higher, a bullish sign of strength.
Breakout zone: Price is currently challenging resistance in the ~$2.80–$3.00 range. A sustained move above this area would confirm bullish breakout momentum.
Upside targets:
First target: ~$4.49 (prior support turned resistance)
Second target: ~$5.19 (key historical resistance zone)
Trade Setup:
Entry: Current breakout attempt (~$2.85)
Stop-loss: Below recent higher low (~$2.43)
Risk-reward ratio: Favorable, targeting ~60–80% potential upside with limited downside risk.
Summary:
LAC is showing signs of a long-term trend reversal, with a confirmed bottom and bullish higher low. If momentum continues, a breakout rally toward previous resistance levels is likely. Traders may consider this a medium-term opportunity, with a solid technical foundation and clear upside targets.
💥 Free signals and ideas ➡ t.me/vfinvestment
Disclaimer
The information and publications are not meant to be, and do not constitute, financial, investment, trading, or other types of advice or recommendations supplied or endorsed by TradingView. Read more in the Terms of Use.
💥 Free signals and ideas ➡ t.me/vfinvestment
Disclaimer
The information and publications are not meant to be, and do not constitute, financial, investment, trading, or other types of advice or recommendations supplied or endorsed by TradingView. Read more in the Terms of Use.