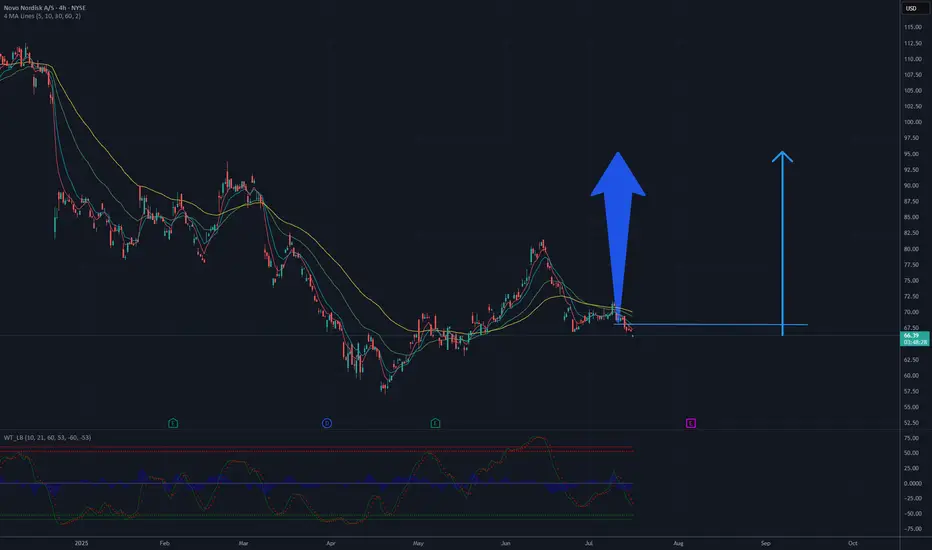
Based on the 4-hour chart of Novo Nordisk A/S (NYSE: NVO), the stock has undergone a strong downward correction from above $165, but is now showing signs of a potential technical bottom near the $65 level. Price action has stabilized, and oscillators indicate oversold conditions, suggesting a possible trend reversal.
The chart shows a short-term consolidation after a bounce, and the moving averages (MA 5/10/30/60) are converging — a setup that often precedes a bullish breakout. The $90–$100 area aligns with former support-turned-resistance zones, making it a natural target for a corrective upward move.
Conclusion: If the current momentum holds and the price breaks out of the local consolidation, a move toward the $90–$100 range appears likely as part of a broader rebound following the extended downtrend.
Potential TP : 90-95 USD
Disclaimer
The information and publications are not meant to be, and do not constitute, financial, investment, trading, or other types of advice or recommendations supplied or endorsed by TradingView. Read more in the Terms of Use.
Disclaimer
The information and publications are not meant to be, and do not constitute, financial, investment, trading, or other types of advice or recommendations supplied or endorsed by TradingView. Read more in the Terms of Use.