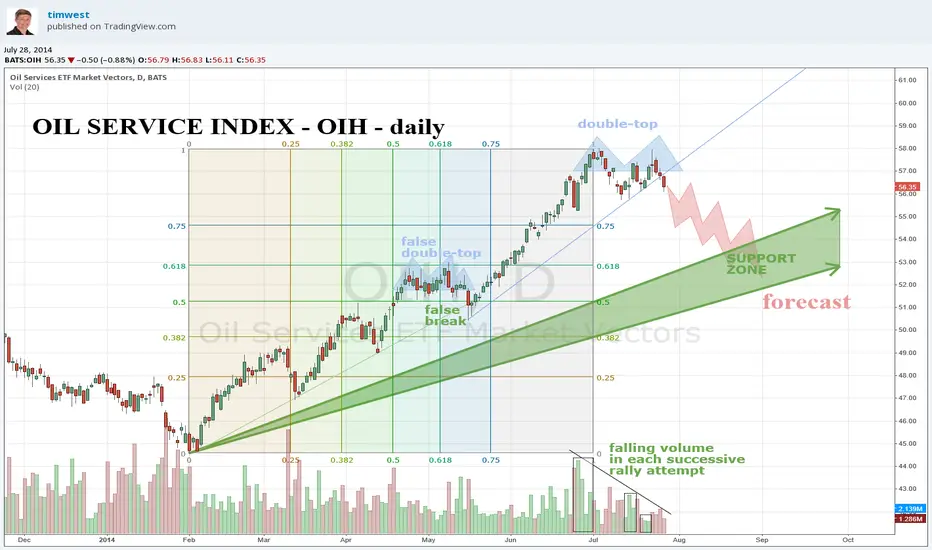
The oil index has had a solid rally this year from the lows in February around the 45 level and has rallied 30% to the 58 level where there now is a double-top pattern. The trendline is a bit steep, but it is broken and I'm looking at two trendlines that move up at between 50% speed and 38.2% speed from the low and provide support down around the 53 level, a mere 6% drop seems imminent for the OIH over the ensuing 3 months.
Earlier this year, in the spring, I was looking for relative outperformance of the OIH to the S&P500, so now that it has outperformed and provided a decent return over the past 3-4 months, it would seem logical to reduce holdings or at least sell calls (at the money) against long term positions.
Note the other charts I have published on OIH.
Regards,
Tim 12:09PM EST 7/28/2014 56.34 -0.51 last
Subscribe to my indicator package KEY HIDDEN LEVELS $10/mo or $100/year and join me in the trading room KEY HIDDEN LEVELS here at TradingView.com
Disclaimer
The information and publications are not meant to be, and do not constitute, financial, investment, trading, or other types of advice or recommendations supplied or endorsed by TradingView. Read more in the Terms of Use.
Disclaimer
The information and publications are not meant to be, and do not constitute, financial, investment, trading, or other types of advice or recommendations supplied or endorsed by TradingView. Read more in the Terms of Use.