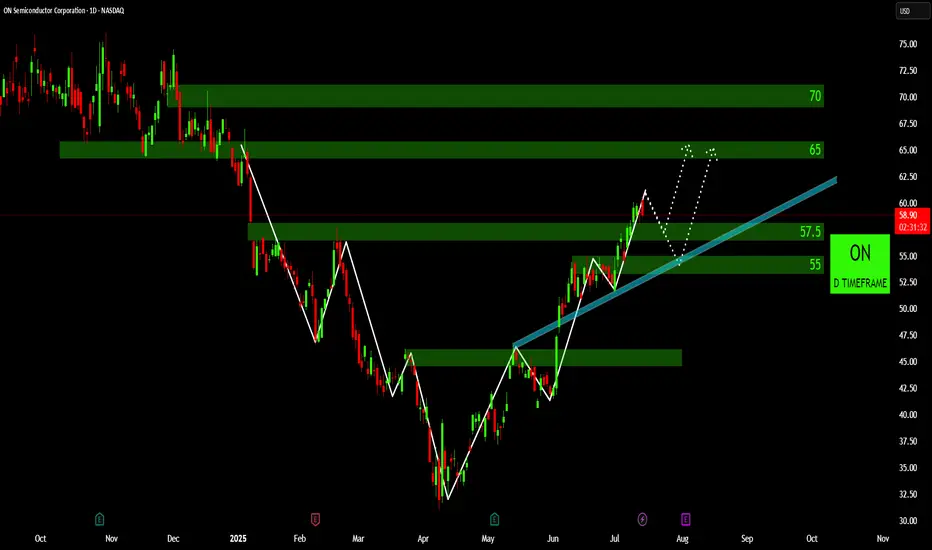
Bullish Trendline in Play: The price action since late April/early May clearly demonstrates an upward-sloping trendline (highlighted in light blue), indicating a sustained bullish momentum. The price has respected this trendline on multiple occasions, suggesting its significance as dynamic support.
Recent Breakout and Retest of Resistance: The chart shows a recent decisive breakout above the 57.50 level, which previously acted as resistance. Following the breakout, the price has seen a retest of this level, successfully holding above it, which is often a bullish confirmation.
Identified Supply Zones Ahead: There are two distinct green-highlighted zones above the current price, marked at 65 and 70. These represent potential supply zones or resistance levels where profit-taking or increased selling pressure could occur.
Potential for ABCD Harmonic Pattern: The dotted white lines indicate a potential ABCD harmonic pattern formation. Should this pattern play out, it suggests a possible corrective move towards the 55-57.50 zone before a further upward trajectory towards the 65 and then potentially 70 levels.
Key Support Zone Established: The green-highlighted area around the 55 level, coinciding with the bullish trendline, appears to be a significant support zone. A sustained breakdown below this level would invalidate the current bullish structure and warrant a re-evaluation of the trend.
Disclaimer:
The information provided in this chart is for educational and informational purposes only and should not be considered as investment advice. Trading and investing involve substantial risk and are not suitable for every investor. You should carefully consider your financial situation and consult with a financial advisor before making any investment decisions. The creator of this chart does not guarantee any specific outcome or profit and is not responsible for any losses incurred as a result of using this information. Past performance is not indicative of future results. Use this information at your own risk. This chart has been created for my own improvement in Trading and Investment Analysis. Please do your own analysis before any investments.
Disclaimer
The information and publications are not meant to be, and do not constitute, financial, investment, trading, or other types of advice or recommendations supplied or endorsed by TradingView. Read more in the Terms of Use.
Disclaimer
The information and publications are not meant to be, and do not constitute, financial, investment, trading, or other types of advice or recommendations supplied or endorsed by TradingView. Read more in the Terms of Use.