🧠 Chart Analysis Summary:
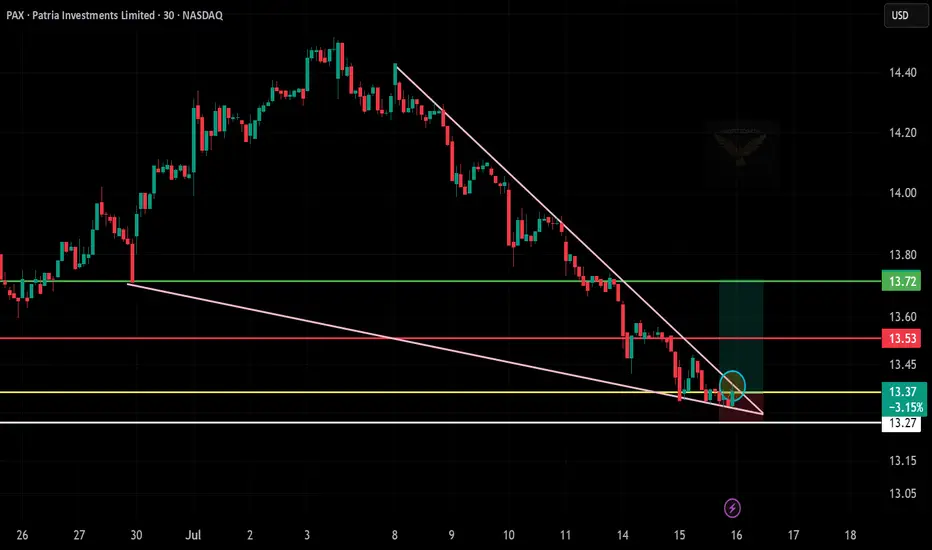
Pattern: Falling wedge breakout spotted — a classic bullish reversal pattern.
Current Price: $13.37
Support Zone:
$13.27 (white line, holding support)
Breakout Confirmation: Price is pushing out of the wedge with a small green move (circle).
📊 Key Levels:
Entry Zone: $13.35–$13.40
Target 1: $13.53 (red line – short-term resistance)
Target 2: $13.72 (green line – wedge target zone)
Stop-Loss: Below $13.25
🎯 Trade Idea (Bullish Bias):
Entry: $13.35–13.40
Target: $13.72
Stop-Loss: $13.25
Disclaimer
The information and publications are not meant to be, and do not constitute, financial, investment, trading, or other types of advice or recommendations supplied or endorsed by TradingView. Read more in the Terms of Use.
Disclaimer
The information and publications are not meant to be, and do not constitute, financial, investment, trading, or other types of advice or recommendations supplied or endorsed by TradingView. Read more in the Terms of Use.