PepsiCo Yielded 10.5% for 30 Years and Is Now a Bargain
This is an idea for short-term investors like me who are willing to make a 20% gain in the upcoming weeks, but it is also a long-term entry for those who want to include PepsiCo in their portfolio to enjoy a substantial dividend and the potential to continue experiencing 10.5% annual growth, as it has for the past 30 years.

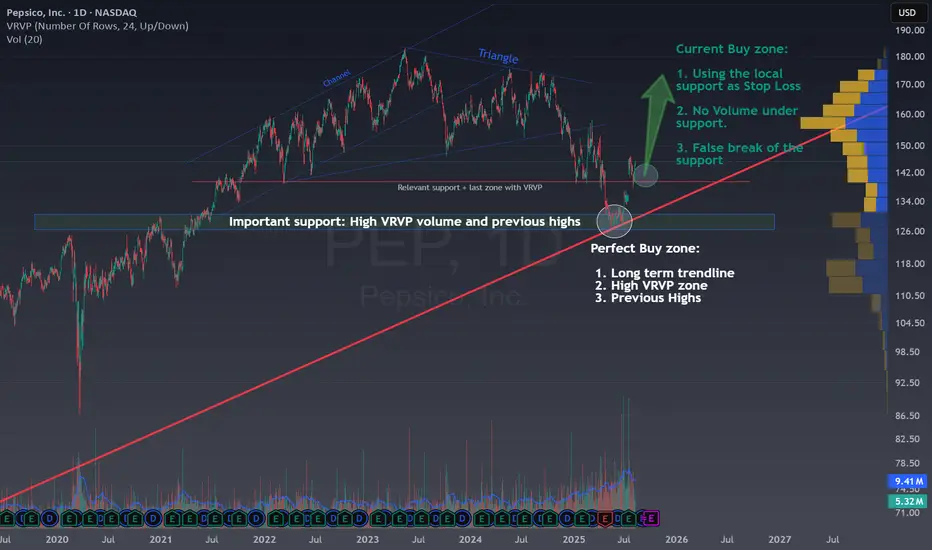
In the chart above, you can see PepsiCo’s 30-year trendline, which is very important because as long as PepsiCo respects this trendline, a 10.5% yearly growth is expected.

During 2022 and 2023, a channel developed marking the stock’s upward path.
In September 2023, the channel was broken, signaling that in the coming months or years, we might not see new highs.

After that breakout, a triangle appeared, which is usually a continuation pattern, giving hope to bullish investors.
However, as happens with about 30% of triangles, this one broke on the less common side, confirming that PepsiCo was not ready to continue growing.
In fact, breaking this triangle confirmed that we were going to see the price testing the previous resistance area, where there was a high volume of concentrated buying around the $128–130 zone.
For traders familiar with chart patterns, this meant a perfect 15% drop to take advantage of, and there was even an ideal pullback to the triangle, offering a second chance to join the imminent decline.
⭐ Current situation
After the channel breakout that offered a 10% gain and the triangle breakout that yielded 15%, I’m now convinced we’ll have opportunities in the opposite direction, with potential buys that could return 20% in just a few days.
Buying near the red support zone, around $140, offers the chance to set take profits at 20% (~$170) or at the $150 area for a quicker gain.
The risk is minimal, if the price breaks below the red support, it’s better to stay out and look for other opportunities. So, in this setup, I would place the stop loss at $136 (less than 3% risk), just below a recent gap that should offer some protection.
Therefore, we are aiming for a 20% profit while risking only 3%. The risk-to-reward ratio is 7 to 1, which is absolutely incredible and definitely worth taking advantage of.
💬 Does this setup align with your view on PEP?
PEP?
🚀 Hit the rocket if this helped you spot the opportunity and follow for more easy, educational trade ideas!
This is an idea for short-term investors like me who are willing to make a 20% gain in the upcoming weeks, but it is also a long-term entry for those who want to include PepsiCo in their portfolio to enjoy a substantial dividend and the potential to continue experiencing 10.5% annual growth, as it has for the past 30 years.
In the chart above, you can see PepsiCo’s 30-year trendline, which is very important because as long as PepsiCo respects this trendline, a 10.5% yearly growth is expected.
During 2022 and 2023, a channel developed marking the stock’s upward path.
In September 2023, the channel was broken, signaling that in the coming months or years, we might not see new highs.
After that breakout, a triangle appeared, which is usually a continuation pattern, giving hope to bullish investors.
However, as happens with about 30% of triangles, this one broke on the less common side, confirming that PepsiCo was not ready to continue growing.
In fact, breaking this triangle confirmed that we were going to see the price testing the previous resistance area, where there was a high volume of concentrated buying around the $128–130 zone.
For traders familiar with chart patterns, this meant a perfect 15% drop to take advantage of, and there was even an ideal pullback to the triangle, offering a second chance to join the imminent decline.
⭐ Current situation
After the channel breakout that offered a 10% gain and the triangle breakout that yielded 15%, I’m now convinced we’ll have opportunities in the opposite direction, with potential buys that could return 20% in just a few days.
Buying near the red support zone, around $140, offers the chance to set take profits at 20% (~$170) or at the $150 area for a quicker gain.
The risk is minimal, if the price breaks below the red support, it’s better to stay out and look for other opportunities. So, in this setup, I would place the stop loss at $136 (less than 3% risk), just below a recent gap that should offer some protection.
Therefore, we are aiming for a 20% profit while risking only 3%. The risk-to-reward ratio is 7 to 1, which is absolutely incredible and definitely worth taking advantage of.
💬 Does this setup align with your view on
🚀 Hit the rocket if this helped you spot the opportunity and follow for more easy, educational trade ideas!
Related publications
Disclaimer
The information and publications are not meant to be, and do not constitute, financial, investment, trading, or other types of advice or recommendations supplied or endorsed by TradingView. Read more in the Terms of Use.
Related publications
Disclaimer
The information and publications are not meant to be, and do not constitute, financial, investment, trading, or other types of advice or recommendations supplied or endorsed by TradingView. Read more in the Terms of Use.