Moving Averages (Simple & Exponential): All signals (from 5‑day to 200‑day) in both SMA & EMA suggest strong BUY .
Trend Oscillators:
MACD: Bullish with positive value ~134 .
ADX/DMI: ADX ~23 indicates weak trend, but DMI+ (32.8) > DMI– (14.8), signalling a bullish bias .
Momentum Oscillators:
RSI (~75), Stochastic K/D (~85/71), and Stochastic RSI K/D (~100/81) all in overbought territory.
CCI (~195), PSAR (~14,150) and Momentum (~4,343) are bullish.
However, True Range (~1,071) and ATR (~647) show heightened volatility—coded as SELL signals Technical Summary (May): ~83% of indicators were BUY signals, with 7% SELL, and 10% NEUTRAL
Note
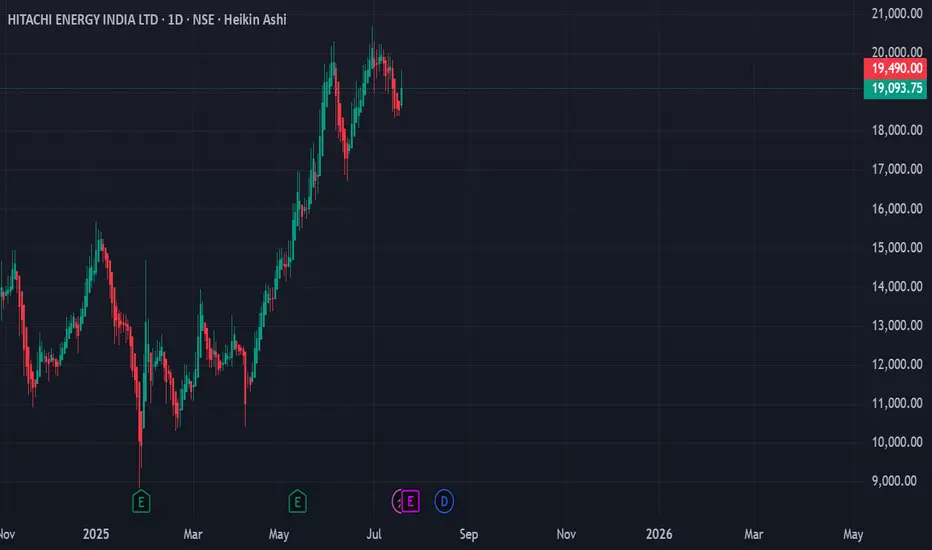
LTP-19093Disclaimer
The information and publications are not meant to be, and do not constitute, financial, investment, trading, or other types of advice or recommendations supplied or endorsed by TradingView. Read more in the Terms of Use.
Disclaimer
The information and publications are not meant to be, and do not constitute, financial, investment, trading, or other types of advice or recommendations supplied or endorsed by TradingView. Read more in the Terms of Use.