Gap above price causing R for QDEL..but support is not too far below..
T2/Long term/ 361.5 to 415
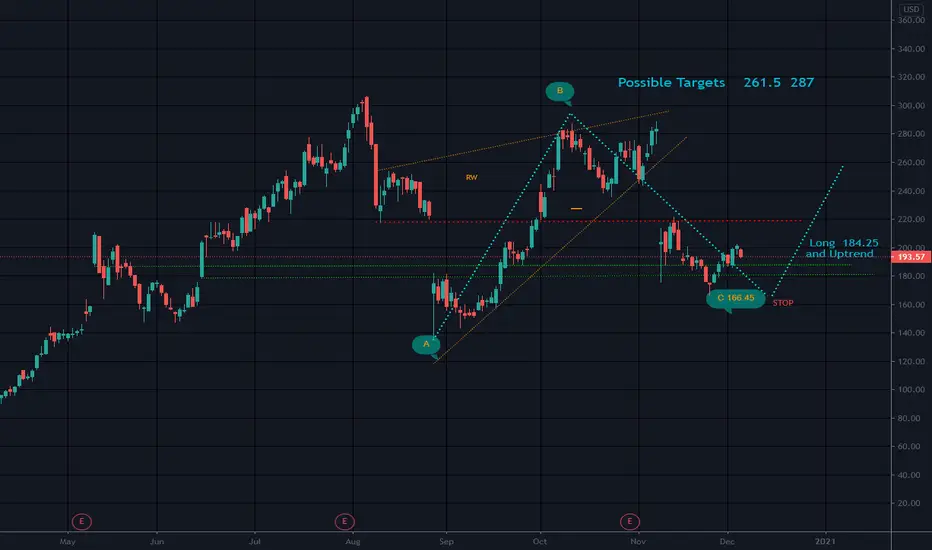
Possible stop below C...
ABC/D is a correction pattern and D is the target. I do not call this an ABCD pattern because D is still unknown. Although there are targets you can calculate from the AB leg, it is still invisible and you just enver know for sure what will happen. This pattern is a measured move down..
NV and OBV are high/short interest not terribly high but higher than I like at 6.78%..
QDEL fell from a Rising and narrowing wedge pattern, but seems to be trying to bounce back..I am asuming this is a covid stock a long with MRNA, BNTX etc, but this one has a long history and decent fundamentals..
Went from a long slow uptrend to an almost arcish rise 8 months ago..guess that is about the time the flu really hit the market in full steam and QDEL makes testing equipment..
Previous high was 306.72 and QDEL took a fall to 164.9ish..
According to RSI which is pointing down, this may pull back a bit. Weekly and monthly candles are dojis..Momentum seems to be picking up a bit so who knows..Price will unfold in next week or 2 perhaps..
Not a recommendation..
Good luck
T2/Long term/ 361.5 to 415
Possible stop below C...
ABC/D is a correction pattern and D is the target. I do not call this an ABCD pattern because D is still unknown. Although there are targets you can calculate from the AB leg, it is still invisible and you just enver know for sure what will happen. This pattern is a measured move down..
NV and OBV are high/short interest not terribly high but higher than I like at 6.78%..
QDEL fell from a Rising and narrowing wedge pattern, but seems to be trying to bounce back..I am asuming this is a covid stock a long with MRNA, BNTX etc, but this one has a long history and decent fundamentals..
Went from a long slow uptrend to an almost arcish rise 8 months ago..guess that is about the time the flu really hit the market in full steam and QDEL makes testing equipment..
Previous high was 306.72 and QDEL took a fall to 164.9ish..
According to RSI which is pointing down, this may pull back a bit. Weekly and monthly candles are dojis..Momentum seems to be picking up a bit so who knows..Price will unfold in next week or 2 perhaps..
Not a recommendation..
Good luck
Disclaimer
The information and publications are not meant to be, and do not constitute, financial, investment, trading, or other types of advice or recommendations supplied or endorsed by TradingView. Read more in the Terms of Use.
Disclaimer
The information and publications are not meant to be, and do not constitute, financial, investment, trading, or other types of advice or recommendations supplied or endorsed by TradingView. Read more in the Terms of Use.