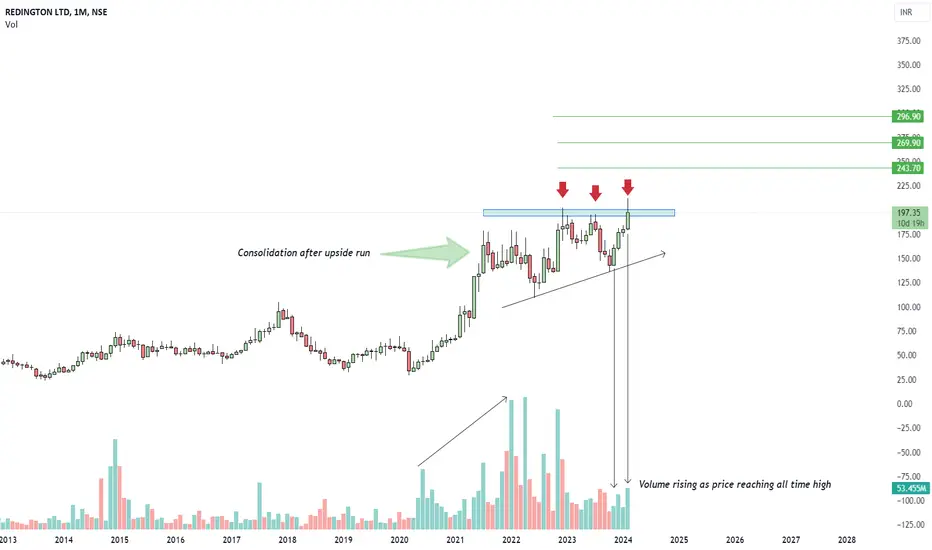
Chart pattern - Ascending Triangle Pattern
Volume Understanding - As price is increasing upside volume also increasing, that concludes the sign of bullish run
Price is trading near all time high with higher high higher lows
Time frame - Monthly
Volume Understanding - As price is increasing upside volume also increasing, that concludes the sign of bullish run
Price is trading near all time high with higher high higher lows
Time frame - Monthly
Note
going wellNote
Holding Well in weak marketNote
Indecisive closing on monthly time frame chartNote
getting ready for targetDisclaimer
The information and publications are not meant to be, and do not constitute, financial, investment, trading, or other types of advice or recommendations supplied or endorsed by TradingView. Read more in the Terms of Use.
Disclaimer
The information and publications are not meant to be, and do not constitute, financial, investment, trading, or other types of advice or recommendations supplied or endorsed by TradingView. Read more in the Terms of Use.