Timeframe: Weekly | Idea Type: Technical + Smart Money Flow
🧠 Technical Analysis:
=============================================
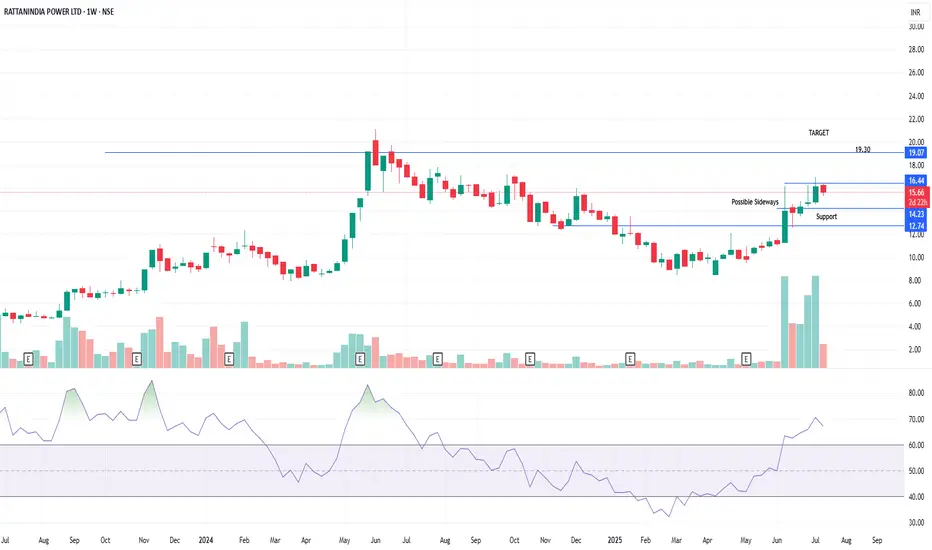
📈 Stock is currently testing a key resistance zone around ₹16.44, after a strong uptrend.
📉 Possible sideways consolidation around ₹14.23–₹16.44 zone as shown on chart.
🧱 Support Levels:
₹14.23 (near-term support)
₹12.74 (base support zone)
🎯 Upside Target: ₹19.30 — if breakout sustains above ₹16.44 with strong volume.
📊 Volume Surge observed during recent rallies, suggesting accumulation.
💪 RSI above 70, signaling strength but also possible overbought conditions short-term.
💼 Shareholding Trend (as of June 2025):
=============================================
🏢 Promoter Holding stable at 44.06% (unchanged in 9 quarters).
🌍 FII/FPI holding increased from 0.31% (2023) to 4.95% (2025) — strong positive signal.
🏛️ DII holding steady around 6.63%.
📈 Non-Institutional holding has declined, suggesting smart money entry.
Conclusion:
================
“Smart money accumulation (FII/FPI rise), RSI breakout, and volume spike suggest a brewing breakout, but wait for confirmation above ₹16.44.”
🧠 Technical Analysis:
=============================================
📈 Stock is currently testing a key resistance zone around ₹16.44, after a strong uptrend.
📉 Possible sideways consolidation around ₹14.23–₹16.44 zone as shown on chart.
🧱 Support Levels:
₹14.23 (near-term support)
₹12.74 (base support zone)
🎯 Upside Target: ₹19.30 — if breakout sustains above ₹16.44 with strong volume.
📊 Volume Surge observed during recent rallies, suggesting accumulation.
💪 RSI above 70, signaling strength but also possible overbought conditions short-term.
💼 Shareholding Trend (as of June 2025):
=============================================
🏢 Promoter Holding stable at 44.06% (unchanged in 9 quarters).
🌍 FII/FPI holding increased from 0.31% (2023) to 4.95% (2025) — strong positive signal.
🏛️ DII holding steady around 6.63%.
📈 Non-Institutional holding has declined, suggesting smart money entry.
Conclusion:
================
“Smart money accumulation (FII/FPI rise), RSI breakout, and volume spike suggest a brewing breakout, but wait for confirmation above ₹16.44.”
Disclaimer
The information and publications are not meant to be, and do not constitute, financial, investment, trading, or other types of advice or recommendations supplied or endorsed by TradingView. Read more in the Terms of Use.
Disclaimer
The information and publications are not meant to be, and do not constitute, financial, investment, trading, or other types of advice or recommendations supplied or endorsed by TradingView. Read more in the Terms of Use.