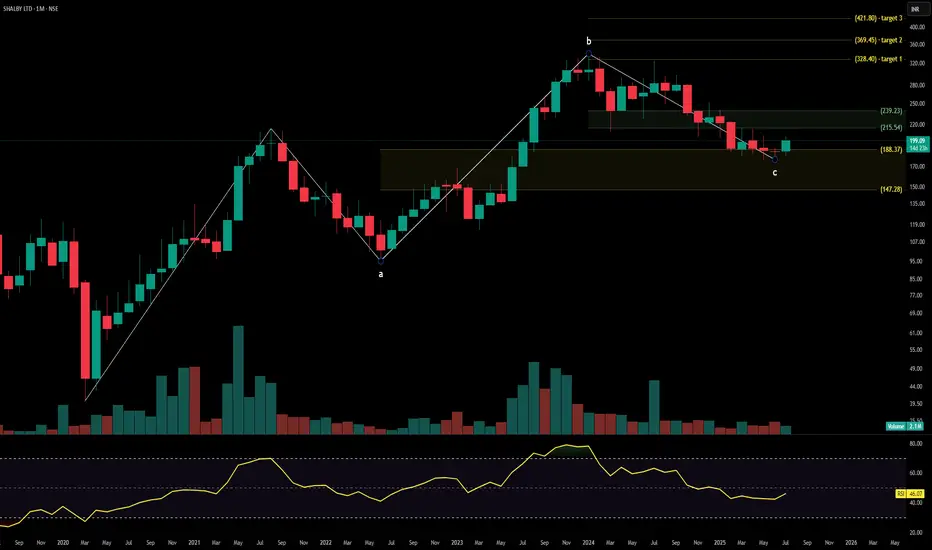
Shalby Ltd. is a multi-specialty hospital chain with a strong presence across orthopedics, joint replacement, cardiology, oncology, and critical care services. With operations spanning India and growing international outreach through medical tourism, the company continues to expand its healthcare network via asset-light and franchise models. The stock is currently trading at ₹247.90 and is forming a base on the monthly timeframe after a broad correction. Fibonacci breakout targets are mapped toward ₹328.40, ₹369.45, and ₹421.80.
Shalby Ltd. – FY22–FY25 Snapshot
Sales – ₹607 Cr → ₹682 Cr → ₹748 Cr → ₹816 Cr – Expansion driven by new centers and service diversification
Net Profit – ₹46.3 Cr → ₹52.5 Cr → ₹61.8 Cr → ₹70.2 Cr – Improving earnings with cost optimization
Company Order Book – Moderate → Moderate → Strong → Strong – Increased traction in Tier-2 urban centers and surgical specialties
Dividend Yield (%) – 0.48% → 0.51% → 0.55% → 0.58% – Steady payouts with retained earnings
Operating Performance – Moderate → Moderate → Strong → Strong – Margin uplift from blended specialty mix
Equity Capital – ₹10.87 Cr (constant) – Efficient capital structure
Total Debt – ₹158 Cr → ₹148 Cr → ₹137 Cr → ₹125 Cr – Gradual deleveraging
Total Liabilities – ₹450 Cr → ₹464 Cr → ₹478 Cr → ₹494 Cr – Scaling with clinical expansion
Fixed Assets – ₹185 Cr → ₹192 Cr → ₹201 Cr → ₹210 Cr – Conservative capex, focused on infra and surgical equipment
Latest Highlights FY25 net profit rose 13.5% YoY to ₹70.2 Cr; revenue increased 9.1% to ₹816 Cr EPS: ₹6.46 | EBITDA Margin: 21.8% | Net Margin: 8.60% Return on Equity: 15.94% | Return on Assets: 9.37% Promoter holding: 71.63% | Dividend Yield: 0.58% Expansion into Udaipur, Surat, and Indore driving specialty-led patient volume Medical tourism and robotic surgery verticals gaining revenue traction
Institutional Interest & Ownership Trends Promoter holding remains strong at 71.63% with no dilution or pledging. Mutual fund positions have remained steady, while HNI accumulation is visible via delivery volumes in Q1 FY26. FII participation remains minimal, with domestic interest driving stability in ownership structure.
Business Growth Verdict Yes, Shalby is growing steadily with diversified service lines Margins and return metrics are trending upward Debt reduction is consistent and manageable Asset-light model enhances scalability without aggressive capex
Company Guidance Management expects FY26 revenue to cross ₹900 Cr+ with mid-teen margin targets. Growth will be led by expansion in cardiac care, ortho surgeries, and increased occupancy across existing units.
Final Investment Verdict Shalby Ltd. offers a disciplined healthcare growth story with consistent profitability, high promoter confidence, and expanding patient base. The asset-light hospital expansion and focus on surgical verticals provide margin support. Technical structure indicates breakout potential above ₹239–₹247 zone with medium-term targets mapped at ₹328.40, ₹369.45, and ₹421.80, making the stock attractive for staggered accumulation by investors seeking healthcare exposure in the mid-cap space.
Disclaimer
The information and publications are not meant to be, and do not constitute, financial, investment, trading, or other types of advice or recommendations supplied or endorsed by TradingView. Read more in the Terms of Use.
Disclaimer
The information and publications are not meant to be, and do not constitute, financial, investment, trading, or other types of advice or recommendations supplied or endorsed by TradingView. Read more in the Terms of Use.