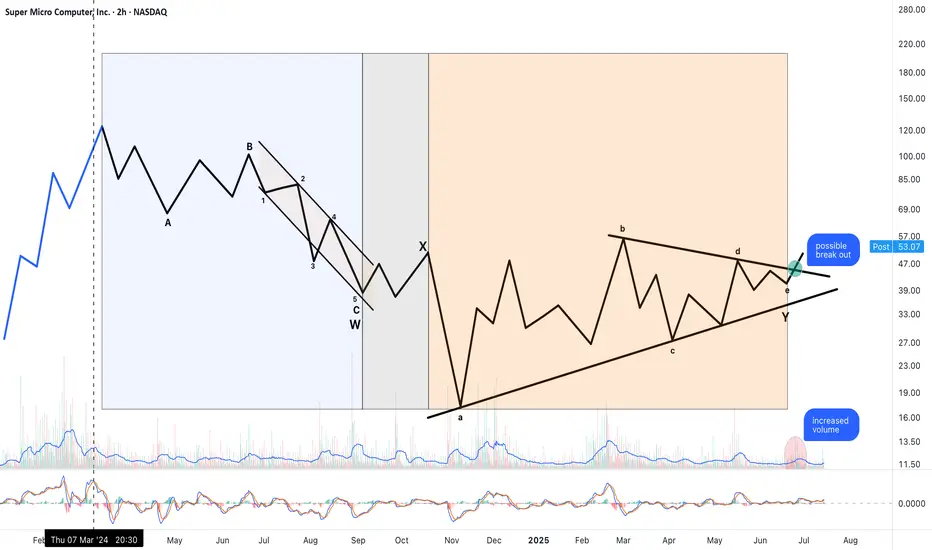
This chart illustrates a possible NeoWave-style corrective combination: a Flat–X–Triangle structure, likely completed and followed by a breakout.
W Wave: A well-structured Flat correction (labeled A–B–C) with a clean internal 5-wave impulse in C. Balanced time and volume across subcomponents suggest structural completion.
X Wave: A simple, proportionally shallow X connector, in line with NeoWave time and price minimums.
Y Wave: A textbook contracting triangle (labeled a–b–c–d–e), with near-perfect Fibonacci relationships between legs:
• Wave b retraces approximately 61.8% of wave a
• Wave d retraces approximately 78.6% of wave c
• Time symmetry is preserved
• Volume compresses into the apex, a classic triangle behavior
Breakout Observed:
• Price has moved above triangle resistance
• Volume increased at breakout
• MACD shows positive crossover and rising momentum
Interpretation:
This may mark the end of a prolonged corrective structure and the beginning of a new impulsive sequence. Triangle projection targets suggest the $77–80 area as a minimum, with higher Fibonacci extensions possible (e.g., 1.618 or 2.618 of prior moves) if this evolves into a 3rd wave.
Technical Approach:
This analysis follows NeoWave principles (Glenn Neely), emphasizing structural clarity, wave proportion, time-price balance, and breakout behavior.
Note
“Constructive feedback and NeoWave discussions are welcome.”Disclaimer
The information and publications are not meant to be, and do not constitute, financial, investment, trading, or other types of advice or recommendations supplied or endorsed by TradingView. Read more in the Terms of Use.
Disclaimer
The information and publications are not meant to be, and do not constitute, financial, investment, trading, or other types of advice or recommendations supplied or endorsed by TradingView. Read more in the Terms of Use.