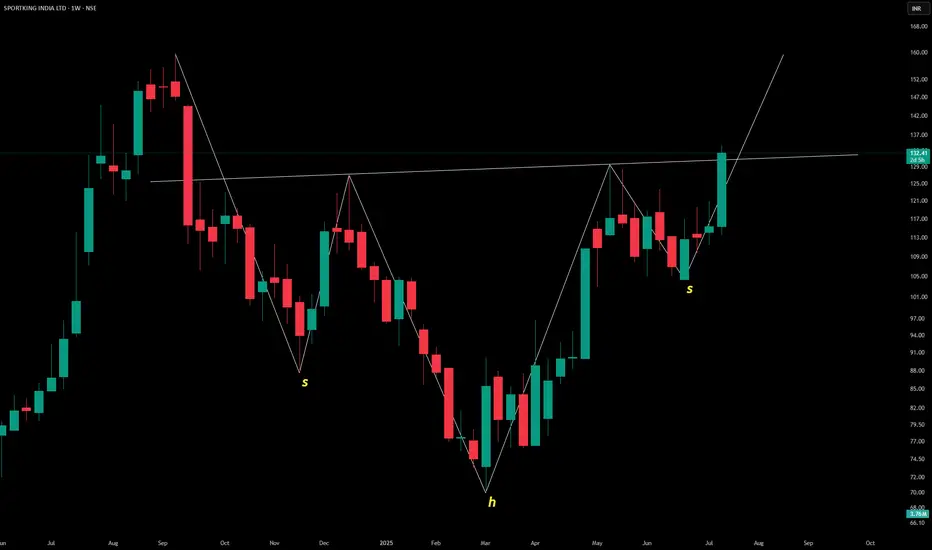
The weekly chart shows a classic **inverted head and shoulders** formation:
- 👈 **Left Shoulder**: Shallow trough
- 🔽 **Head**: Deep central low
- 👉 **Right Shoulder**: Higher trough mirroring the left
Price action around ₹132.48 suggests a potential **bullish reversal**, indicating that the prior downtrend may be bottoming out. A breakout above the neckline would typically confirm upward momentum—worth watching for volume confirmation and resistance levels.
Let me know if you’d like projected targets or neckline levels next!
Disclaimer
The information and publications are not meant to be, and do not constitute, financial, investment, trading, or other types of advice or recommendations supplied or endorsed by TradingView. Read more in the Terms of Use.
Disclaimer
The information and publications are not meant to be, and do not constitute, financial, investment, trading, or other types of advice or recommendations supplied or endorsed by TradingView. Read more in the Terms of Use.