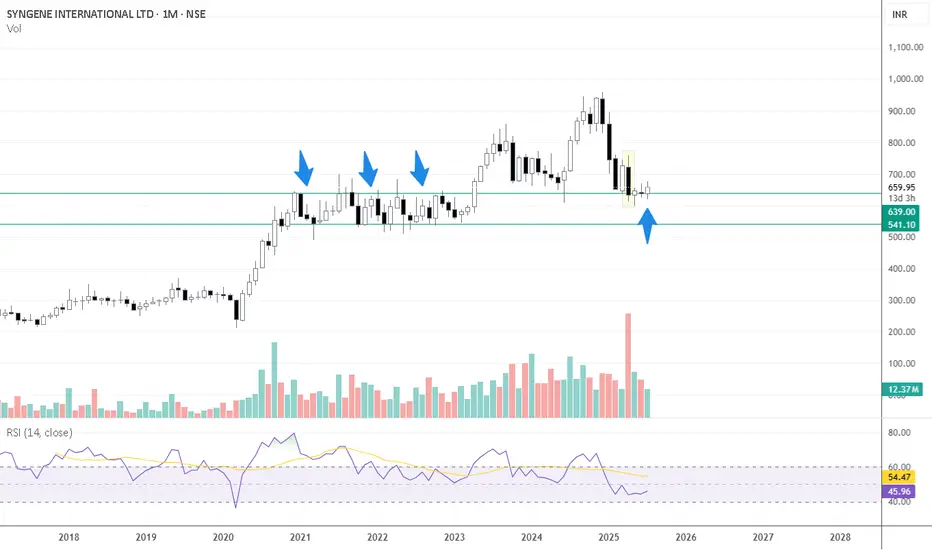
📈 Monthly Chart – Key Support at Old Peaks
The stock has recently revisited the ₹600–₹610 range, which corresponds to a previous consolidation and monthly swing-low zone (~₹607) from November 2020 to April 2023 on the monthly timeframe
This zone isn’t just another support level—it represents an area where price historically spent over 2.5 years, making multiple tests before breaking higher. Such zones often act as strong demand zones when revisited
A sustained hold above ₹607 would reinforce this support, signaling a potential base for a multi-month reversal or bounce
🕯️ April Monthly Candle – Selling Exhaustion?
Large bearish candle in April (FY25 Q4 results month).
High volume, which often signals capitulation or Selling climax.
Price has since stayed within the range of this candle-no breakout above or below.
Indicates a potential exhaustion of sellers if the stock holds above the low of that candle, this structure often represents a volatility compression after a sharp move-like a spring coiling.
Disclaimer
The information and publications are not meant to be, and do not constitute, financial, investment, trading, or other types of advice or recommendations supplied or endorsed by TradingView. Read more in the Terms of Use.
Disclaimer
The information and publications are not meant to be, and do not constitute, financial, investment, trading, or other types of advice or recommendations supplied or endorsed by TradingView. Read more in the Terms of Use.