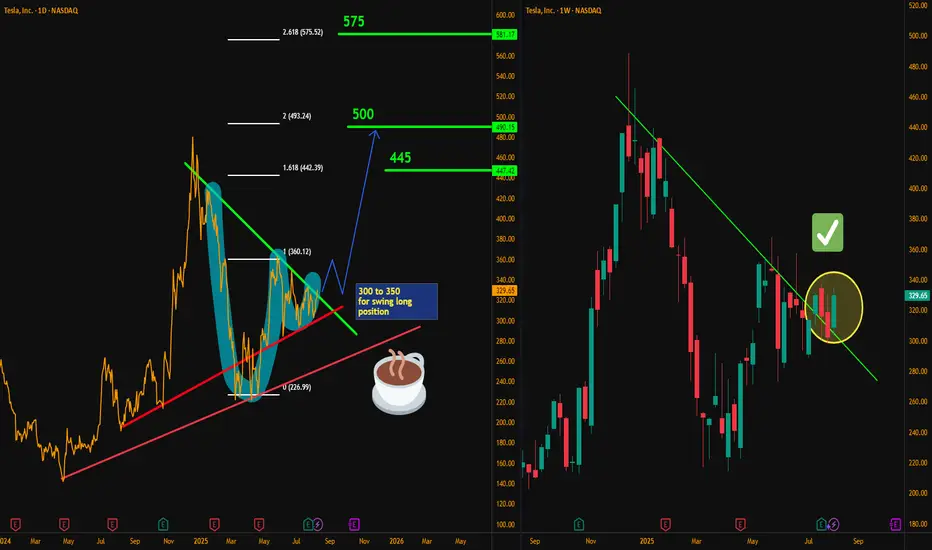
Hello traders, here’s my latest analysis on Tesla (TSLA) based on the weekly and daily timeframes. On the weekly chart, I have drawn a downtrend line starting from December 2024, and the recent price action shows a breakout above this line on a weekly close. This breakout is a promising sign that an uptrend may be developing in the medium term.
On the daily chart, we can see a cup & handle pattern forming, which is a bullish continuation structure. However, the daily downtrend drawn from the December 2024 highs remains unbroken, so I will need to see a weekly close above the $332 resistance level to confirm a swing long setup.
My preferred positioning zone for longs is between $300 and $350, using a multi-entry approach to average into the trade. My upside targets are $366, $445, $500, and finally $575. These levels align with inverse Fibonacci projections, with “safety 1” at $360 and “0” at $227, pointing toward the 161, 200, and 261 extensions as key objectives.
For stop-loss placement, patient traders who are willing to hold through volatility may consider a weekly close below $265 as their invalidation point. For faster or more short-term oriented traders, a weekly close below $300 could be used as a tighter stop level. Although I believe it is unlikely for price to drop this far, even if it does, I expect strong buying interest and a potential rebound from the $265 support zone.
Risk management remains crucial for this setup. I recommend not risking more than 10% of your capital, scaling in over multiple entries, and always confirming with your own strategy before committing to the trade. Position sizing and discipline will be key to managing volatility and protecting capital.
 TSLA
TSLA
On the daily chart, we can see a cup & handle pattern forming, which is a bullish continuation structure. However, the daily downtrend drawn from the December 2024 highs remains unbroken, so I will need to see a weekly close above the $332 resistance level to confirm a swing long setup.
My preferred positioning zone for longs is between $300 and $350, using a multi-entry approach to average into the trade. My upside targets are $366, $445, $500, and finally $575. These levels align with inverse Fibonacci projections, with “safety 1” at $360 and “0” at $227, pointing toward the 161, 200, and 261 extensions as key objectives.
For stop-loss placement, patient traders who are willing to hold through volatility may consider a weekly close below $265 as their invalidation point. For faster or more short-term oriented traders, a weekly close below $300 could be used as a tighter stop level. Although I believe it is unlikely for price to drop this far, even if it does, I expect strong buying interest and a potential rebound from the $265 support zone.
Risk management remains crucial for this setup. I recommend not risking more than 10% of your capital, scaling in over multiple entries, and always confirming with your own strategy before committing to the trade. Position sizing and discipline will be key to managing volatility and protecting capital.
Trade active
Disclaimer
The information and publications are not meant to be, and do not constitute, financial, investment, trading, or other types of advice or recommendations supplied or endorsed by TradingView. Read more in the Terms of Use.
Disclaimer
The information and publications are not meant to be, and do not constitute, financial, investment, trading, or other types of advice or recommendations supplied or endorsed by TradingView. Read more in the Terms of Use.