No change in view
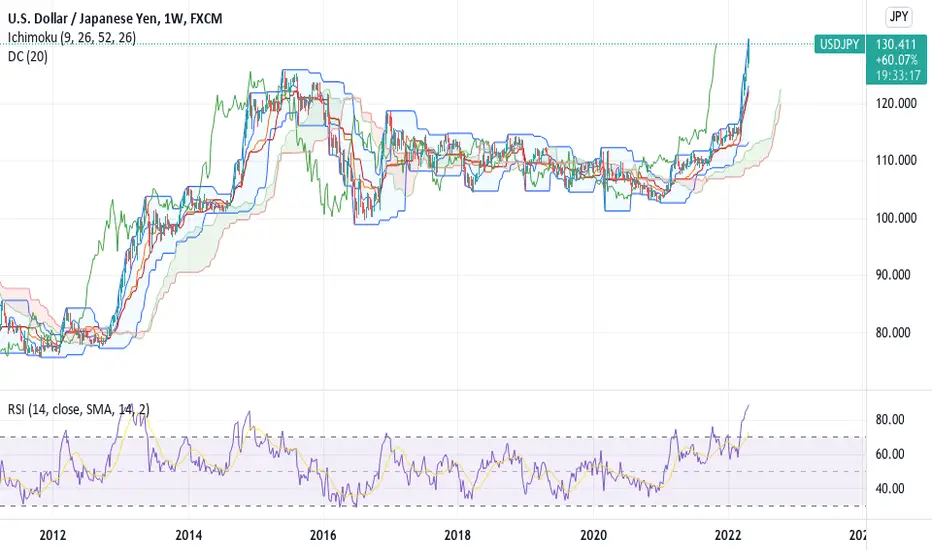
I had added @ 131.20 again as I am very convinced it is overextended. Average now 128.50.
When we look at historical judgment, the correction for weekly chart will be anywhere from 4-6 big figs, which would mean the high 131.00 (rounded) suggests return level of 125.00 - 126.00. Using he monthly chart in combination, first correction of the weekly chart can cause a move up after before the total of 15 big figs correction needed for monthly chart will complete. The end stop will be somewhere 116.00 based on that.
I am not saying I got a crystal ball, but this is what I believe is possible.
I wish to note, that everyone adjust to their own style or develop one, and it is depending also to the risk level one wishes to take. Me personally, I take reasonable risks, but always make sure regarding leverage. The start positions are always very small, and I consider market may go higher. The comments seen are great, but always remember you are responsible for your own money management, same as I am for mine. :)
The strategy for new positions is SELL current 130.50-130.80 and add above 131.20 again. Take backs are partly based on your own parameters and position, but for me now changed to:
35% @ 127.98
30% @ 126.57
Balance @ 124.87.
The strategy will be to re-sell when buy-backs have happened and will update you on my activity.
Note
minor change will take-back 35% @ 128.40 and re-sell on pull back upwards. Rest orders unchanged.Disclaimer
The information and publications are not meant to be, and do not constitute, financial, investment, trading, or other types of advice or recommendations supplied or endorsed by TradingView. Read more in the Terms of Use.
Disclaimer
The information and publications are not meant to be, and do not constitute, financial, investment, trading, or other types of advice or recommendations supplied or endorsed by TradingView. Read more in the Terms of Use.