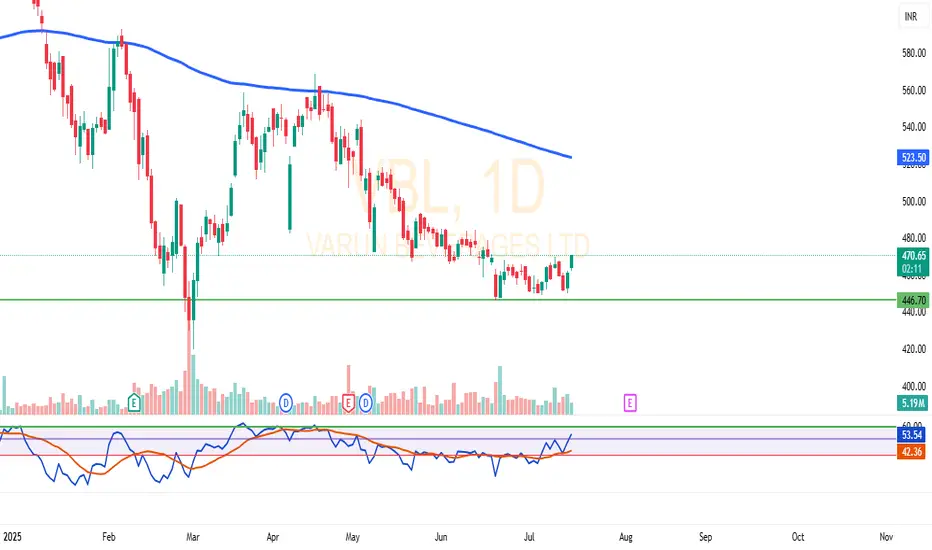
VBL has shown multiple rebounds from the strong support zone around ₹446.
After several weeks of sideways consolidation, the stock is attempting a breakout with increased volume in the current session.
The RSI indicator has moved above the 50 level with a bullish crossover, indicating potential strength building up.
On the upside, the 200 EMA near ₹523 may act as a resistance level.
📊 This is a technical observation based on price structure, volume, and momentum — not a buy/sell recommendation.
The setup appears interesting for technical traders watching for a breakout from this range.
🔍 What’s your take on this pattern? Feel free to share your view in the comments.
Disclaimer
The information and publications are not meant to be, and do not constitute, financial, investment, trading, or other types of advice or recommendations supplied or endorsed by TradingView. Read more in the Terms of Use.
Disclaimer
The information and publications are not meant to be, and do not constitute, financial, investment, trading, or other types of advice or recommendations supplied or endorsed by TradingView. Read more in the Terms of Use.