1. Six-Month Price Trend
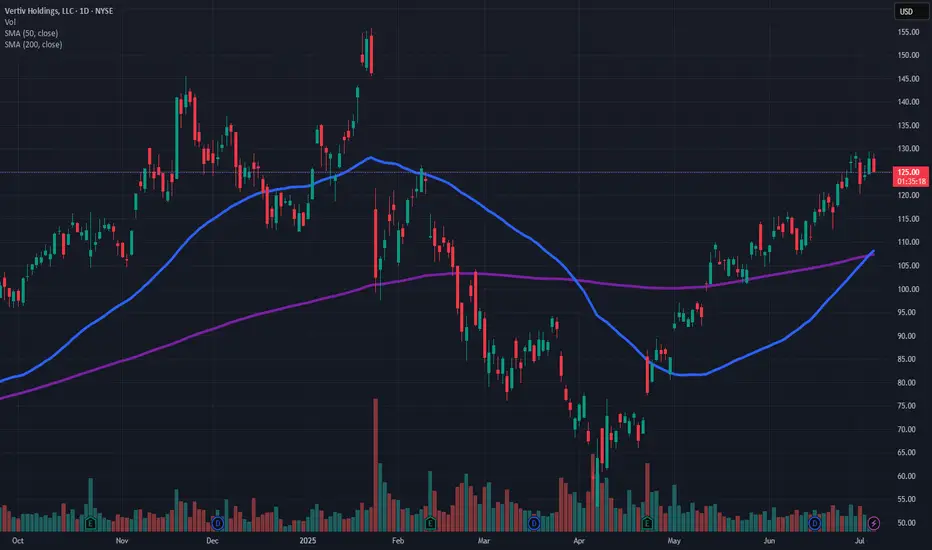
Long-term uptrend: Over the past 6 months, VRT has climbed from ~ $54 to a recent high around $155—deep into a clear bullish channel
Pullbacks vs higher lows: Corrections have consistently bounced off rising trend-lines and key moving averages (50 & 200-day), reinforcing the uptrend .
🛡️ 2. Key Support & Resistance Levels
Support: Near the 50‑day SMA (~$108–$110)—previous pullbacks found strong buying interest here.
Fibonacci retracement zone: Around $117–$117.5 (61.8% from the 52-week high) also has historical support .
Resistance:
Around $155–$156, the recent 52-week high marks the first major hurdle.
Interim resistance around $128–$130, aligning with various pivot point R‑levels and the 6-month consolidation top .
📊 3. Momentum Indicators
Financhill & ChartMill: RSI ~66.6–69.7, moving toward overbought but not extreme
Barchart shorter: 62–64—still in bullish-neutral range
MACD
Positive MACD reading: Values range from ~0.11 to +5.7, indicating bullish crossover momentum
Histogram and signal remain supportive of upward momentum.
Stochastics & ADX
Stochastics: Hovering in the 80s (overbought) but often remains elevated during strong uptrends
ADX ~28–29: Indicates a strong trending stock
⚖️ 4. Overall Technical View
Moving averages: 8, 20, 50, 100, 200‑day (both SMA & EMA) are all positively sloped with price above each—bullish alignment across all timeframes
MACD & RSI: Bullish, with MACD above signal line and RSI in bullish territory (though nearing overbought).
Chart patterns: Active long positions, cup‑and‑handle formations, and break above 50 & 200‑day EMAs suggest continuation setups.
✅ 5. Conclusion
VRT is firmly in a bullish technical regime:
Uptrend confirmed by price structure and moving averages.
Momentum indicators (MACD, RSI, ADX) support continued upside.
Key levels to watch: Support near $117–$110, Resistance around $130 and $155.
Recommendation: The setup favours bullish continuation. That said, RSI nearing overbought (~70) suggests caution—look for short-term consolidation or mild pullbacks before new entries.
Final stance: Bullish, with an eye on consolidation phases for optimal timing.
🧭 6. Watch Points
Break above $155 on strong volume = next leg higher.
Drop below 50‑day SMA (~$108) with weakness could signal deeper retracement.
RSI sustaining above 70 may lead to short-term kicker higher—or signal an overextension pause.
Disclaimer
The information and publications are not meant to be, and do not constitute, financial, investment, trading, or other types of advice or recommendations supplied or endorsed by TradingView. Read more in the Terms of Use.
Disclaimer
The information and publications are not meant to be, and do not constitute, financial, investment, trading, or other types of advice or recommendations supplied or endorsed by TradingView. Read more in the Terms of Use.