📊 Chart Overview:
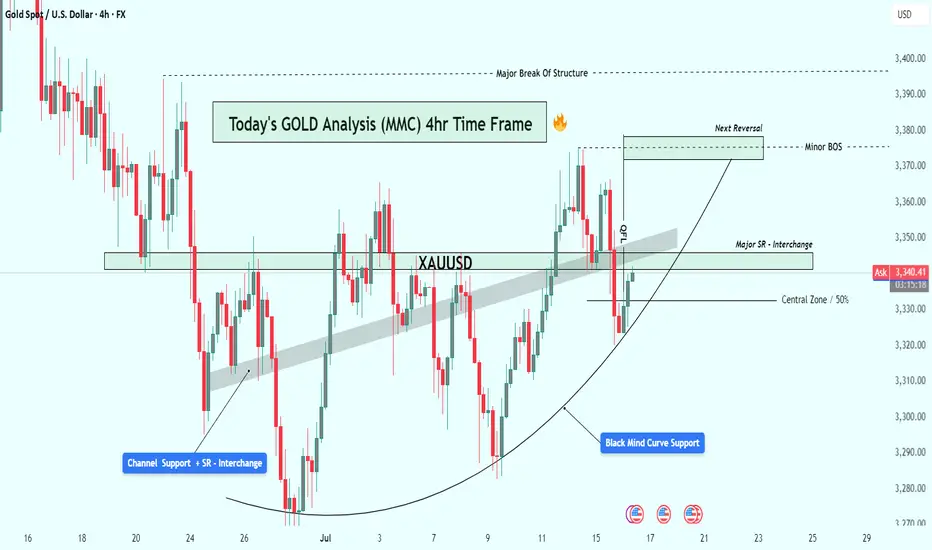
Gold has shown a technically strong structure on the 4-hour time frame, respecting multiple layers of support, while slowly shifting momentum in favor of buyers. What stands out most in this chart is the parabolic curve formation at the bottom, labeled the "Black Mind Curve Support" — a key psychological zone that has guided price action back to the upside.
Let’s walk through the key elements and why this current setup deserves your attention:
🧠 1. Black Mind Curve Support – Bullish Base Formation:
This curved structure at the bottom is no ordinary pattern. It reflects gradual accumulation and buyer dominance, often seen in textbook rounded bottom formations. The market printed multiple higher lows along this curve, suggesting a deliberate and patient entry by smart money.
Whenever price touched this curve, it found strong demand — a clear sign that the bulls are defending their territory.
🧱 2. Channel Support + SR Interchange – Historical Demand:
Zooming into the left side of the chart, you’ll notice how price dropped into a converging zone where a descending channel support intersected with a historical support/resistance (SR) level. This confluence created a high-probability buy zone — the very origin of the current bullish wave.
This channel breakout also represents a structural shift, marking the beginning of bullish control.
🔁 3. Major SR – Interchange Zone:
One of the most critical areas in this chart is the Major SR Interchange zone, where former resistance was broken and later retested as support. This is a classic support-resistance flip — the type of zone institutional traders watch closely.
This level currently acts as a launchpad for bulls, reinforcing bullish structure and offering low-risk long opportunities when respected.
⚔️ 4. Minor BOS (Break of Structure):
Recently, the price broke above a short-term lower high, indicating a minor bullish break of structure. This is confirmation that momentum has shifted in the short term. Such BOS events are powerful signals, especially when backed by curve support and SR flips.
This also paves the way for the price to push into the next liquidity pocket above.
🧭 5. Central Zone – 50% Equilibrium:
The horizontal line drawn around the $3,330 level marks the central 50% zone — the midpoint of this entire price range. This acts as a natural equilibrium zone where buyers and sellers usually fight for control.
Price is now trading above this zone, giving the upper hand to bulls. Holding above the 50% line increases the probability of continuation to higher resistance levels.
🧨 6. Target Area – "Next Reversal Zone":
Looking ahead, the $3,370 – $3,380 range is labeled as the Next Reversal Zone. This is where sellers previously stepped in and rejected price hard. However, if momentum remains strong and bulls can push price into this zone again, we might witness either:
A sharp pullback (if bearish reaction occurs), or
A major breakout above toward the $3,400 key resistance (if buyers overpower).
This is the zone to watch for either short-term profit taking or potential trend continuation setups.
📌 Key Technical Levels:
Immediate Support: $3,330 – $3,315 (Central + Retest Zone)
Major Support: $3,290 (Mind Curve Base)
Short-Term Resistance: $3,370 – $3,380 (Reversal/Reaction Zone)
Bullish Continuation Target: $3,400+
📒 Conclusion & Strategy Insight:
This chart presents a textbook bullish reversal setup with clean structural progression:
Price formed a rounded base
Broke out of previous range resistance
Retested multiple key SR zones
Now targeting liquidity above
The bulls are in control as long as the price remains above the curve and the major SR zone. A retracement into $3,330 could offer an ideal long entry, targeting the $3,370–$3,380 zone with tight risk.
✅ Suggested Trading Approach:
Buy Opportunities: On pullbacks toward $3,330–$3,315 with confirmation
Sell Watch: Near $3,375–$3,380 if bearish divergence or strong rejection appears
Invalidation: Break and close below $3,290 curve support
🧠 Final Thoughts:
Gold continues to build a strong bullish base. The parabolic nature of the support curve suggests rising demand. As long as support holds, the bulls may take price to fresh highs in the coming days.
Keep an eye on how price behaves around the Next Reversal Zone — that will reveal whether this bullish rally is ready for a breakout or a cooldown.
For Daily Trade Setups and Forecast: 📈 t.me/xauusdoptimizer
Premium Signals Fr33: 💯 t.me/xauusdoptimizer
🥰🥳🤩
Premium Signals Fr33: 💯 t.me/xauusdoptimizer
🥰🥳🤩
Related publications
Disclaimer
The information and publications are not meant to be, and do not constitute, financial, investment, trading, or other types of advice or recommendations supplied or endorsed by TradingView. Read more in the Terms of Use.