XBR/USD Chart Analysis: Oil Price Declines Towards Key Support
As the XBR/USD chart shows, Brent crude oil has made two significant moves recently:
Thus, there is reason to believe that the more than 4.5% decline in Brent crude oil prices since the beginning of August reflects market participants’ scepticism about sustained high oil prices:
→ this has a negative impact on the US economy (JP Morgan analysts raised concerns about recession risks this week);
→ increased activity from oil producers may offset supply chain disruption risks.

Technical Analysis of the XBR/USD Chart
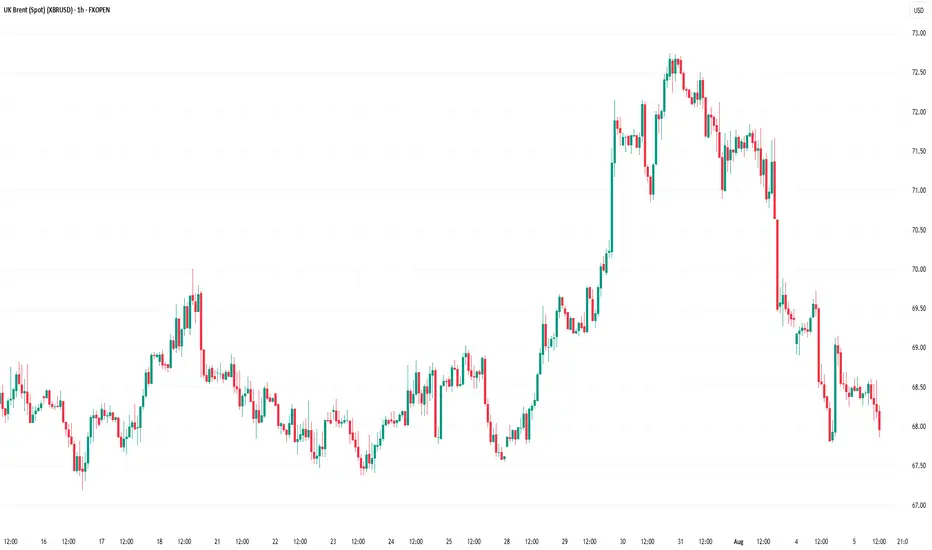
From a technical analysis perspective, Brent crude oil has dropped to a key support level (marked in blue), which was previously active in July. A rebound from this line could happen – in such a case, the price might face resistance at the Fair Value Gap area (marked in orange), formed between:
→ $70.81 – a support level active in late July, which was broken;
→ the psychological level of $70.00.
Attention should also be paid to price behaviour around the $69.00 level (indicated by arrows) – it quickly switched roles from support to resistance, indicating aggressive bearish sentiment. Given this observation, a potential bearish breakout attempt below the blue support line cannot be ruled out.
However, whether this scenario materialises will largely depend on developments in geopolitical risks and tariff agreements.
This article represents the opinion of the Companies operating under the FXOpen brand only. It is not to be construed as an offer, solicitation, or recommendation with respect to products and services provided by the Companies operating under the FXOpen brand, nor is it to be considered financial advice.
As the XBR/USD chart shows, Brent crude oil has made two significant moves recently:
- Last week’s price increase (A) followed President Donald Trump’s intentions to impose tariffs on India due to its purchases of Russian oil. This could have disrupted established oil supply chains.
- The price decline (B) may have been driven by both the decision of OPEC+ countries to increase production and reports of a weakening US labour market.
Thus, there is reason to believe that the more than 4.5% decline in Brent crude oil prices since the beginning of August reflects market participants’ scepticism about sustained high oil prices:
→ this has a negative impact on the US economy (JP Morgan analysts raised concerns about recession risks this week);
→ increased activity from oil producers may offset supply chain disruption risks.
Technical Analysis of the XBR/USD Chart
From a technical analysis perspective, Brent crude oil has dropped to a key support level (marked in blue), which was previously active in July. A rebound from this line could happen – in such a case, the price might face resistance at the Fair Value Gap area (marked in orange), formed between:
→ $70.81 – a support level active in late July, which was broken;
→ the psychological level of $70.00.
Attention should also be paid to price behaviour around the $69.00 level (indicated by arrows) – it quickly switched roles from support to resistance, indicating aggressive bearish sentiment. Given this observation, a potential bearish breakout attempt below the blue support line cannot be ruled out.
However, whether this scenario materialises will largely depend on developments in geopolitical risks and tariff agreements.
This article represents the opinion of the Companies operating under the FXOpen brand only. It is not to be construed as an offer, solicitation, or recommendation with respect to products and services provided by the Companies operating under the FXOpen brand, nor is it to be considered financial advice.
Disclaimer
The information and publications are not meant to be, and do not constitute, financial, investment, trading, or other types of advice or recommendations supplied or endorsed by TradingView. Read more in the Terms of Use.
Disclaimer
The information and publications are not meant to be, and do not constitute, financial, investment, trading, or other types of advice or recommendations supplied or endorsed by TradingView. Read more in the Terms of Use.