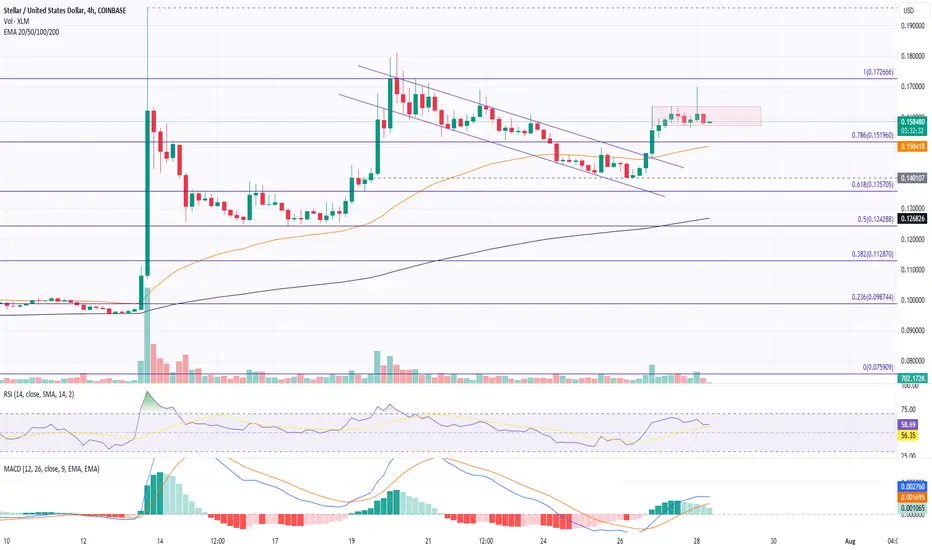
- Despite spikes in XLM prices, the market value struggles to exceed $0.172.
- Recently, XLM has recovered from $0.14, showing a 15% rise, and maintained above the $0.15 mark.
- XLM's price has been consolidating between $0.1550 and $0.1650, suggesting a bullish flag pattern.
- The RSI line is reversing from oversold, indicating a potential retracement, while the MACD and signal lines continue to align bullishly.
- If XLM surpasses the bullish flag pattern, it could ascend towards the $0.172 swing high, with a target of reaching $0.19.
- However, if bearish momentum persists, XLM prices could face an 11% drop, potentially testing the $0.14 support level.
Disclaimer
The information and publications are not meant to be, and do not constitute, financial, investment, trading, or other types of advice or recommendations supplied or endorsed by TradingView. Read more in the Terms of Use.
Disclaimer
The information and publications are not meant to be, and do not constitute, financial, investment, trading, or other types of advice or recommendations supplied or endorsed by TradingView. Read more in the Terms of Use.