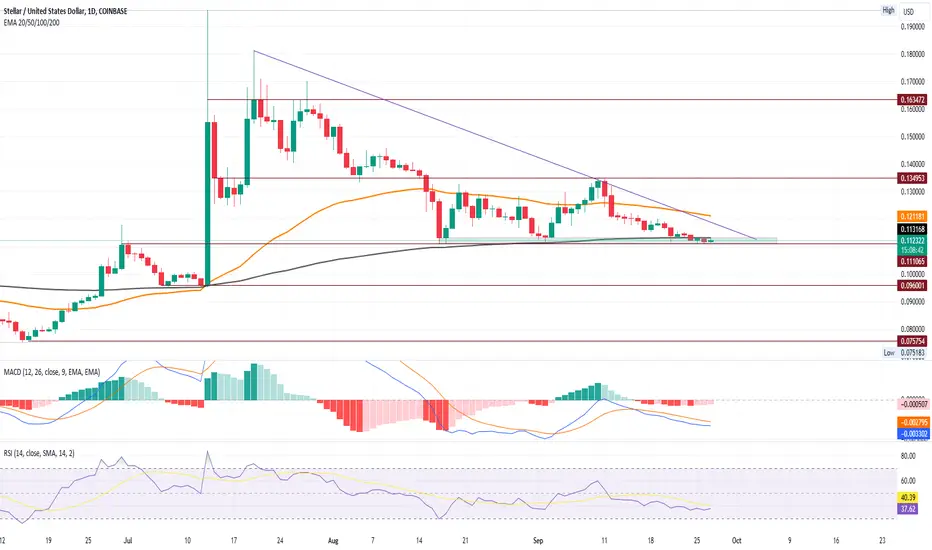
XLM price shows a descending triangle pattern in the daily chart.
Prices are close to the 200-day EMA and $0.11 demand zone.
A breakdown below $0.11 could lead to a plunge to $0.096.
Recent 17% pullback from resistance trendline.
Sideways trend indicates a lack of bullish momentum.
Market price crosses under the crucial 200-day EMA.
Possibility of a death cross if demand zone breaks down.
Currently trading at $0.112 with an intraday gain of 0.37%.
Daily RSI line is declining, approaching the oversold zone.
MACD and signal lines struggle for a bullish crossover.
Bearish histograms are ready to resurface.
Stellar Lumens price is at a critical juncture.
Disclaimer
The information and publications are not meant to be, and do not constitute, financial, investment, trading, or other types of advice or recommendations supplied or endorsed by TradingView. Read more in the Terms of Use.
Disclaimer
The information and publications are not meant to be, and do not constitute, financial, investment, trading, or other types of advice or recommendations supplied or endorsed by TradingView. Read more in the Terms of Use.