In short:
We saw the (almost) same pattern 2 times, now we got to the point where it could repeat.
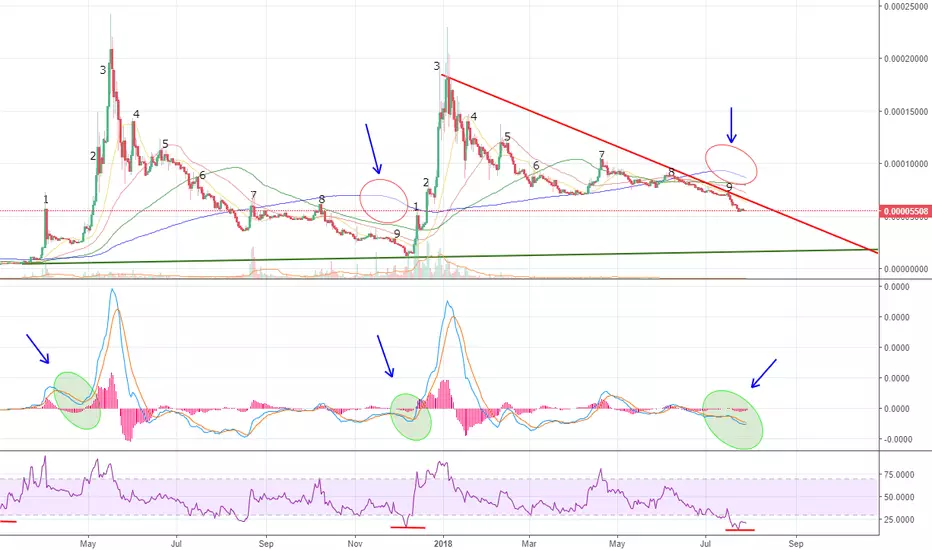
Just comapre the number I wrote on the chart and you'll see how similar it is.
Indicators signing a bullrun:
1. MACD is going to cross. It happened few time before and we saw how much bullish this sign can be.
2. RSI reached the lowest point ever. It's a bullish indicator since we saw what happend the last 2 times it reached this kind of low.
3. 200 EMA started to bend. This means that 50 ema and 100 ema will have an easier time overpassing it resulting in a hard bull signal in just few days.
The 50 and 100 EMA crossing the 200 EMA will be like a magnet for investors since it's a sure entry point.
If it repeats the same pattern as last 2 times, XRP will soon get to 20k satoshis with a possibilty to surpass that point and go even higher.
The only resistence now is 20ema. Once passed, it could go up like crazy.
We saw the (almost) same pattern 2 times, now we got to the point where it could repeat.
Just comapre the number I wrote on the chart and you'll see how similar it is.
Indicators signing a bullrun:
1. MACD is going to cross. It happened few time before and we saw how much bullish this sign can be.
2. RSI reached the lowest point ever. It's a bullish indicator since we saw what happend the last 2 times it reached this kind of low.
3. 200 EMA started to bend. This means that 50 ema and 100 ema will have an easier time overpassing it resulting in a hard bull signal in just few days.
The 50 and 100 EMA crossing the 200 EMA will be like a magnet for investors since it's a sure entry point.
If it repeats the same pattern as last 2 times, XRP will soon get to 20k satoshis with a possibilty to surpass that point and go even higher.
The only resistence now is 20ema. Once passed, it could go up like crazy.
Disclaimer
The information and publications are not meant to be, and do not constitute, financial, investment, trading, or other types of advice or recommendations supplied or endorsed by TradingView. Read more in the Terms of Use.
Disclaimer
The information and publications are not meant to be, and do not constitute, financial, investment, trading, or other types of advice or recommendations supplied or endorsed by TradingView. Read more in the Terms of Use.