lets sing a song 🎧
📌 Key Elements on Chart:
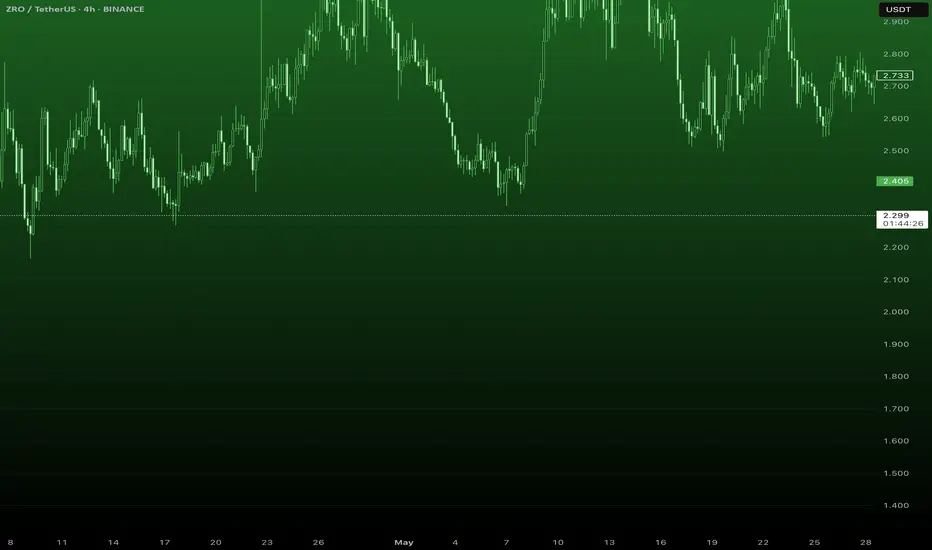
🔴 Resistance Zones (Red Boxes):
Marked from approx 2.35 to 2.50 USDT
Multiple red boxes stacked → showing layered resistance
Price is nearing the upper edge, suggesting rejection likely
🟡 Gann-Like Fan Lines (Yellow):
Multiple ascending support/resistance lines
Price is currently near the upper boundary, testing this zone
🔵 Vertical Time Lines (Cycle Dates):
Marked important time zones where reversal might occur
Noted dates:
July 18, 2025
July 20, 2025
July 21, 2025
Possibly July 22, 2025
🔽 Bearish Arrows:
Arrows indicate expected movement:
Price touches upper resistance
Breaks below fan supports
Heads toward 1.90 – 1.60 USDT range
🧠 Interpretation of This Idea:
You’re expecting a trend reversal after hitting the resistance zone near 2.40–2.50.
Time-based Gann or cycle analysis suggests mid-late July 2025 as a potential trend change window.
The fan lines act as temporary support, but if broken, sharp drop is expected.
This is a counter-trend short setup based on price + time confluence.
📌 Key Elements on Chart:
🔴 Resistance Zones (Red Boxes):
Marked from approx 2.35 to 2.50 USDT
Multiple red boxes stacked → showing layered resistance
Price is nearing the upper edge, suggesting rejection likely
🟡 Gann-Like Fan Lines (Yellow):
Multiple ascending support/resistance lines
Price is currently near the upper boundary, testing this zone
🔵 Vertical Time Lines (Cycle Dates):
Marked important time zones where reversal might occur
Noted dates:
July 18, 2025
July 20, 2025
July 21, 2025
Possibly July 22, 2025
🔽 Bearish Arrows:
Arrows indicate expected movement:
Price touches upper resistance
Breaks below fan supports
Heads toward 1.90 – 1.60 USDT range
🧠 Interpretation of This Idea:
You’re expecting a trend reversal after hitting the resistance zone near 2.40–2.50.
Time-based Gann or cycle analysis suggests mid-late July 2025 as a potential trend change window.
The fan lines act as temporary support, but if broken, sharp drop is expected.
This is a counter-trend short setup based on price + time confluence.
Markets move in angles. I follow the lines.
Disclaimer
The information and publications are not meant to be, and do not constitute, financial, investment, trading, or other types of advice or recommendations supplied or endorsed by TradingView. Read more in the Terms of Use.
Markets move in angles. I follow the lines.
Disclaimer
The information and publications are not meant to be, and do not constitute, financial, investment, trading, or other types of advice or recommendations supplied or endorsed by TradingView. Read more in the Terms of Use.