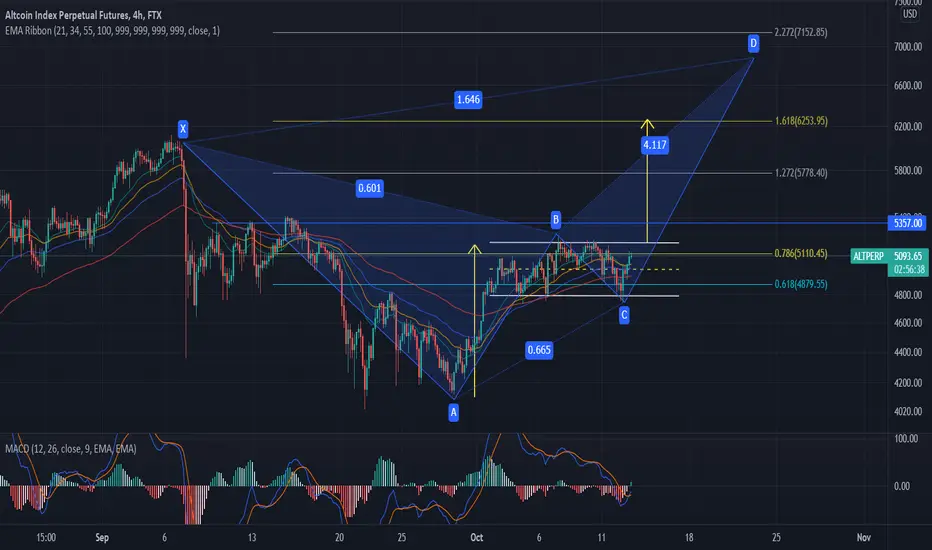
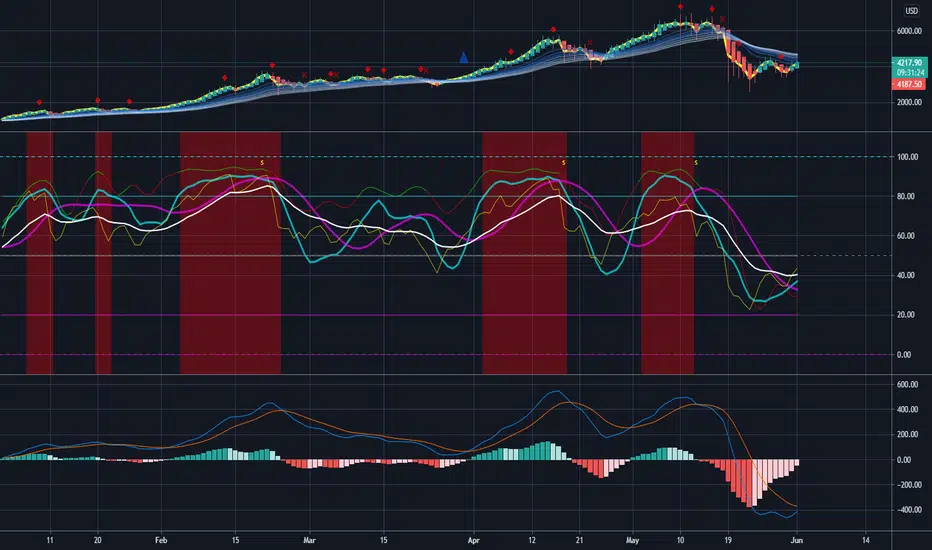
ALT SEASON INDEXsoon alt coin will move #AltSeasonTurn
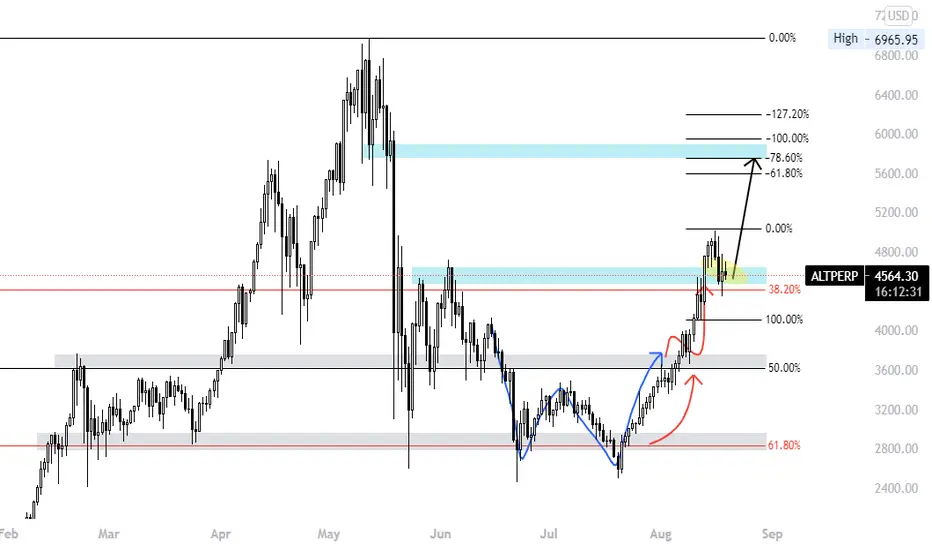
Alt season index showing bearish crab pattern hence will move to upper area before correction.
ALTTON_EQCGNA.USD trade ideas
ALTCOIN SEASON ! LONG ACCORDING TO
the divergence , trend line , support
we expect that bullish trend happened
BUY YOUR FAVORITE ALTCOIN NOW!
suggestions:
ADA
DOT
SOL
THETA
DYDX
MATIC
AAVE
FTM
NEAR
XLM
FTT
QNT
PERP
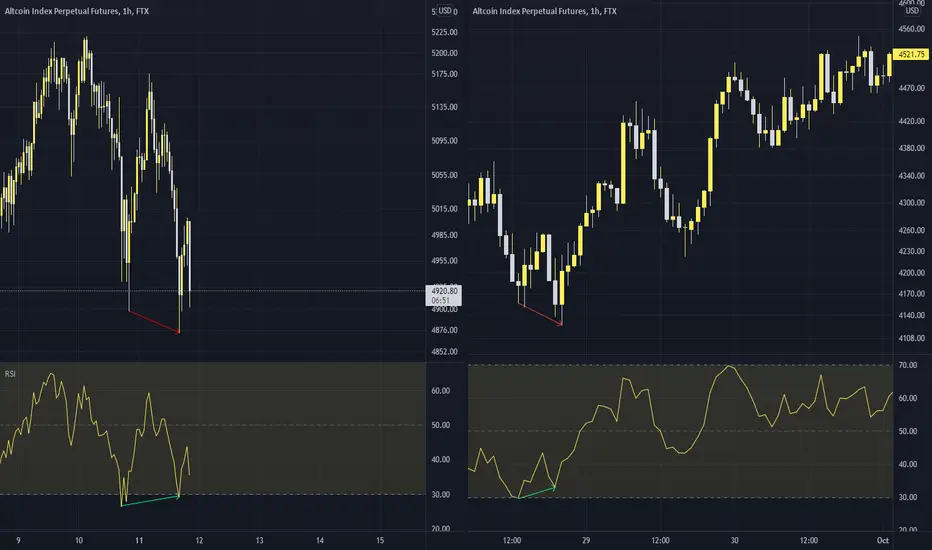
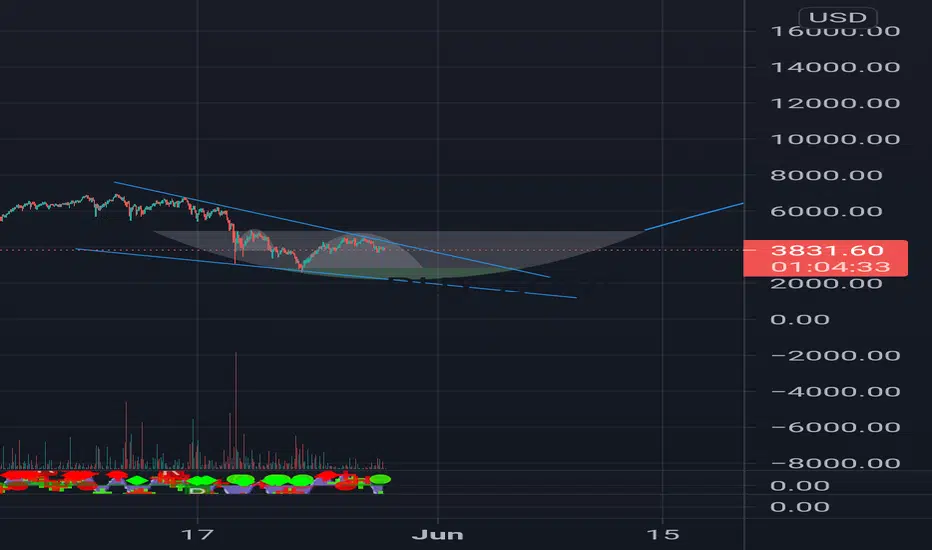
Historically good entry pointsRegular bullish divergence into oversold territory is generally a good spot to get exposed to altcoins.
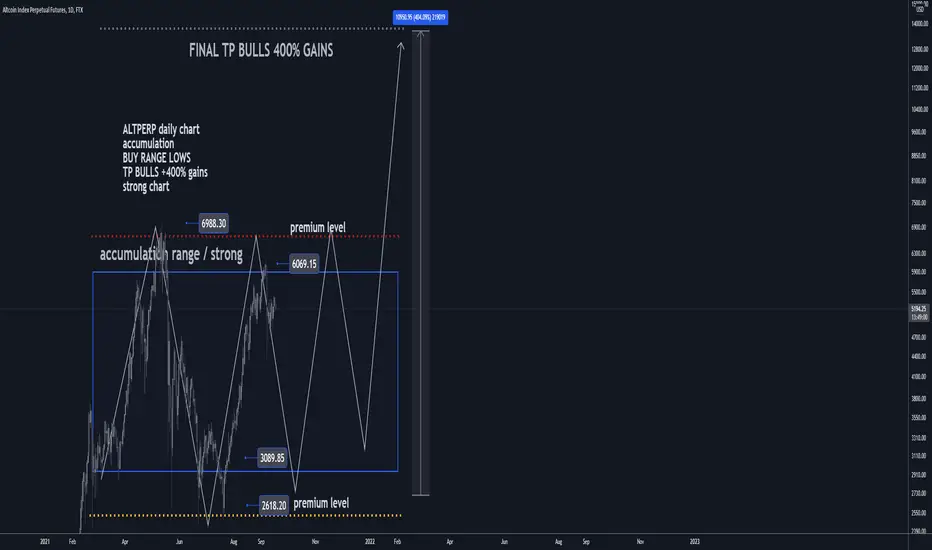
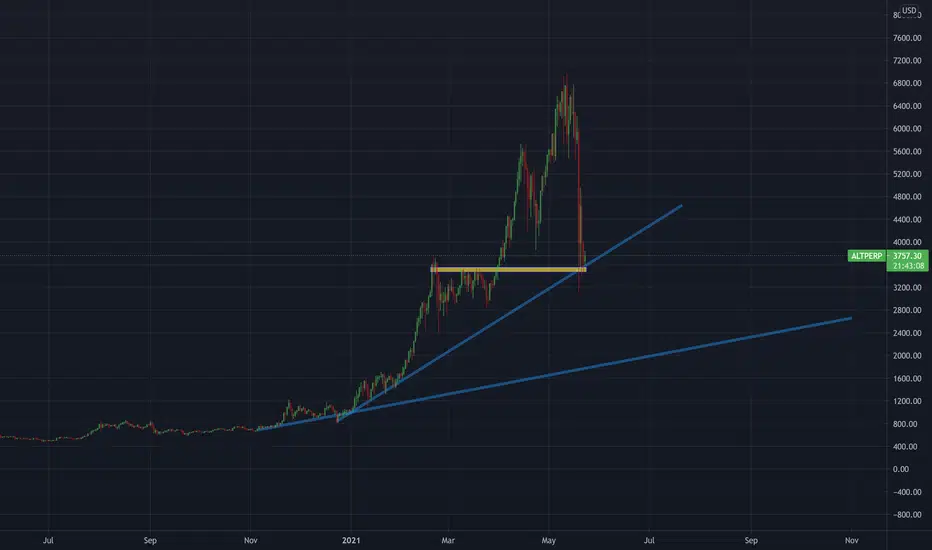
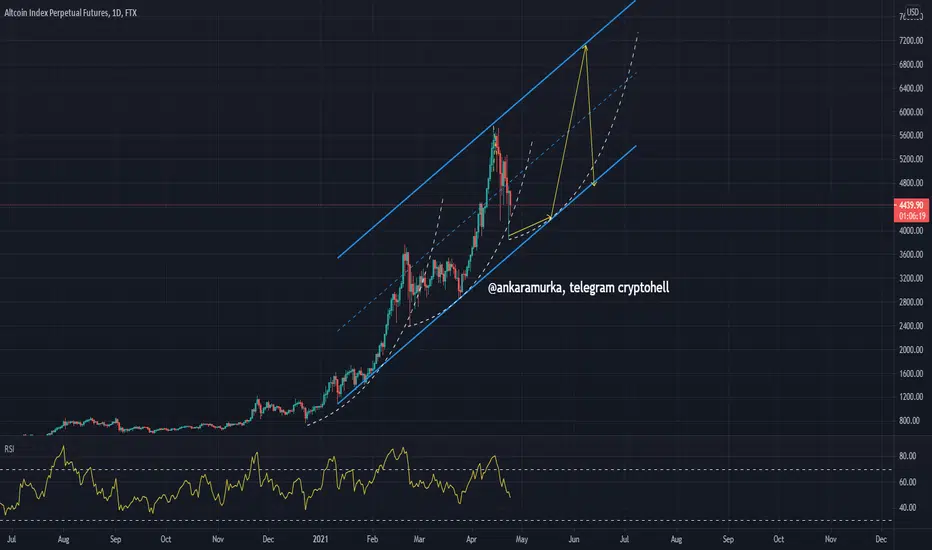
ALTPERP D1: BULLISH CHART: 200%/400% gains in 2021(NEW)Why get subbed to me on Tradingview?
-TOP author on TradingView
-2000+ ideas published
-15+ years experience in markets
-Professional chart break downs
-Supply/Demand Zones
-TD9 counts / combo review
-Key S/R levels
-No junk on my charts
-Frequent updates
-Covering FX/crypto/US stocks
-before/after analysis
-24/7 uptime so constant updates
🎁Please hit the like button and
🎁Leave a comment to support our team!
ALTPERP D1: BULLISH CHART: 200%/400% gains in 2021(NEW)
IMPORTANT NOTE: speculative setup. do your own
due dill. use STOP LOSS. don't overleverage.
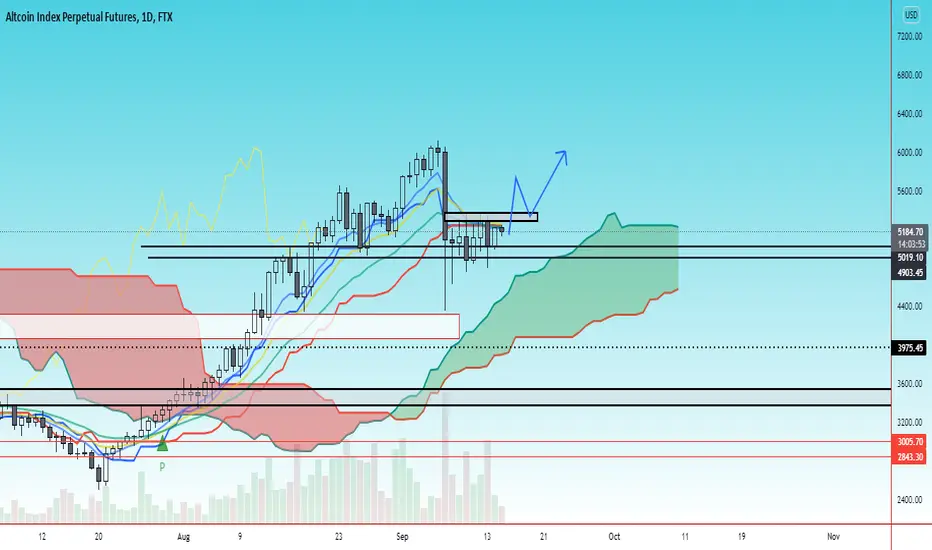
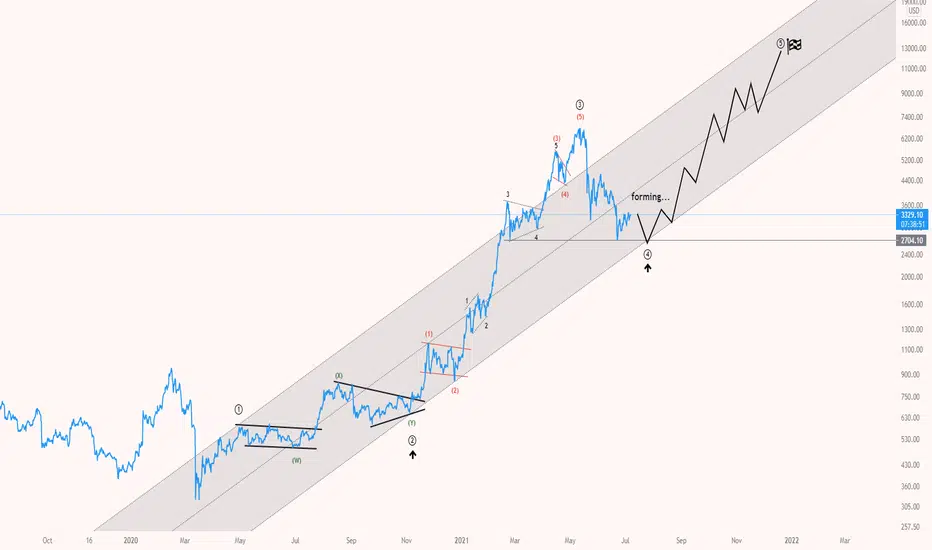
🔸 Summary and potential trade setup
::: ALTPERP 1days/candle chart review/outlook
::: long-term accumulation in progress
::: bullish outlook for alt coins in 2021
::: after we get a correction next few weeks
::: already broke out of range however
::: expecting throwback into range
::: to re-test mid range before JUMP
::: to complete the sequence
::: before it can finally shift into BULL MODE
::: correction is REQUIRED
::: later we can pump 400%+ from that base
::: but that's not until end of 2021
::: limited upside short-term correction
::: bulls have to WAIT AND BUY/HOLD
::: after correction is COMPLETE
::: recommended strategy: WAIT/BUY/HOLD
::: TP BULLS is +200%/+400% gains in 2021
::: this is BUY/HOLD Setup
::: for patient traders only / no fast gains here
::: good luck traders
🔸 Supply/Demand Zones
::: N/A
::: N/A
🔸 Other noteworthy technicals/fundies
::: TD9 /Combo update: N/A
::: Sentiment short-term: BEARS/SWING/CORERECTION
::: Sentiment outlook mid-term: BULLS/MASSIVE PUMP
RISK DISCLAIMER:
Trading Futures , Forex, CFDs and Stocks involves a risk of loss.
Please consider carefully if such trading is appropriate for you.
Past performance is not indicative of future results.
Always limit your leverage and use tight stop loss.
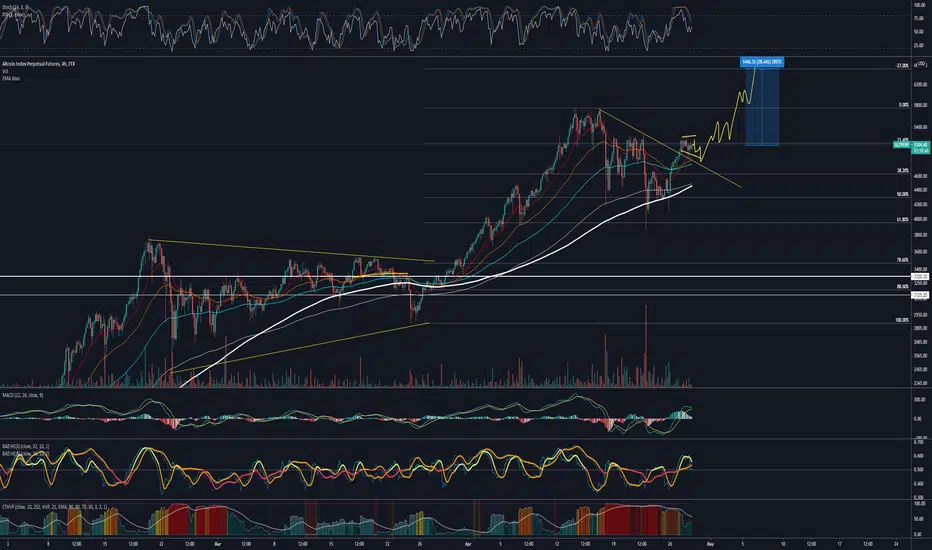
WARNING!!! THIS MUST HAPPEN IF WE WANT TO SEE ALTS FLY.Good morning my friends, my analysis on $BCH was taken down because i might have violated one of the house rules unknowingly to me but its sorted now, and that trade hit my stop because of the unforseen $LTC & BTC manipulation.
so back to the chart this is ALT index has we can see forr the past few days btc have been moving sideways which has caused ALTS to suffer... now it seems btc is growing and its needs to to break amd close above $47753 resistance before we can start loooking for any long oppurnity but i say we stay off alts for now because btc dominance is also rising and you know what that means.
take a good look at this chart we need to break current resistance and retest before further growths of ALTS else we might dump from here and test current support again and God helps us btc dont dump with it cause it will be a blood bath for alts.
stay safe i'll update you guys if needed.
ALT-PERP ReferenceAlt Perp Reference 8/19/21
Thoughts
-Most coins will follow the same or similar patterns
-Alts on support ~ BTC near support
-Extended run rarely pulls back vs Feb Alt szn
-BTC Dom hella low
-What happens when btc.d rises
-W Reversal Patterns, usually reverse bullish again
-Some coins shoot str8 up after b/r daily s/r, why? str8 drop/gaps/vibes
-M,W,M?
-What would I do if I was an institution
-Euphoria, DCB?
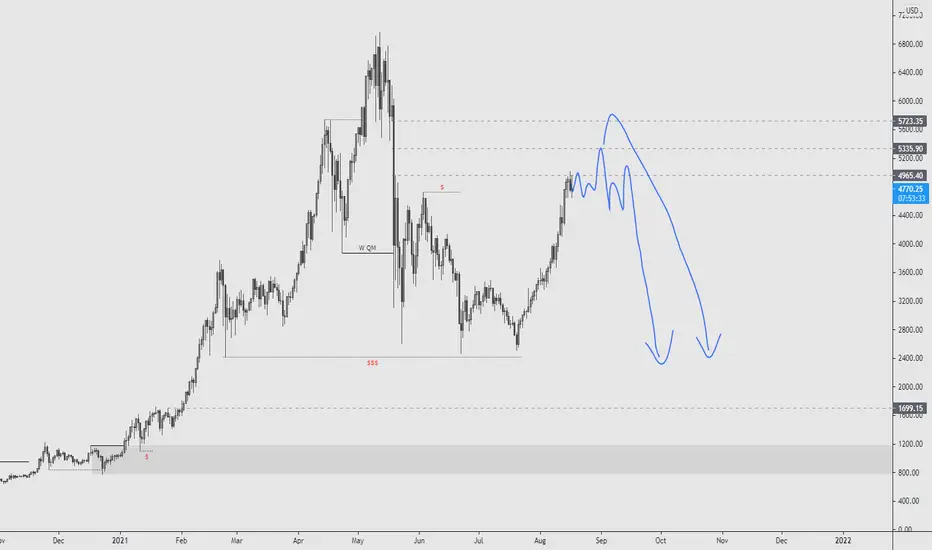
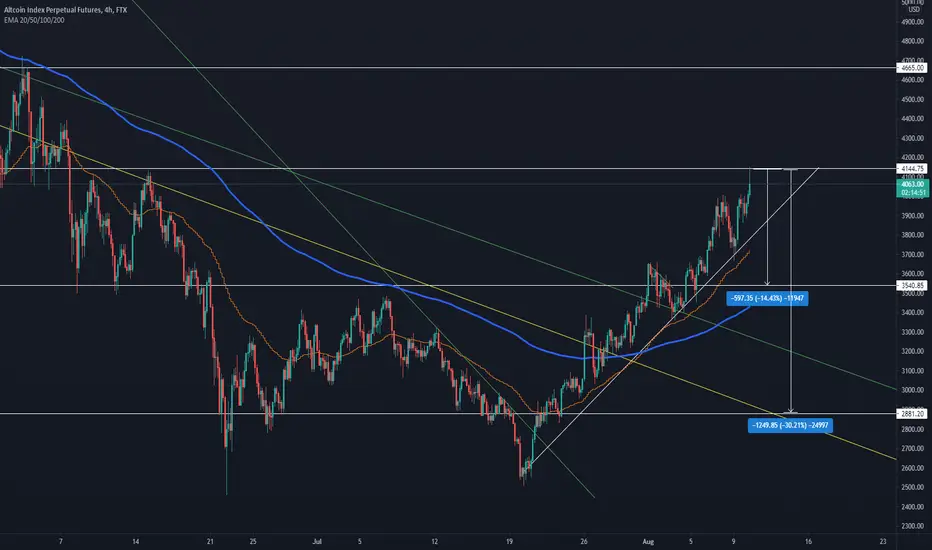
Crypto market looking heavyHey guys,
Just looking through some crypto pairs and I belive this is the next move we're going to see.
I believe we'll see the alt-index face a significant drop; however, I'll need to see confirming price action in this area.
I'm liquidating majority of my alt positons and keeping them in cash in case of a significant discount to accumulate!
Alts should go up We are confirming important resistance on alt index that's why I expect break out soon
ALTPERP dump 15%altcoin possible 15-20% dump, I see it testing the breakout if it holds we see another high if not we dive deeper
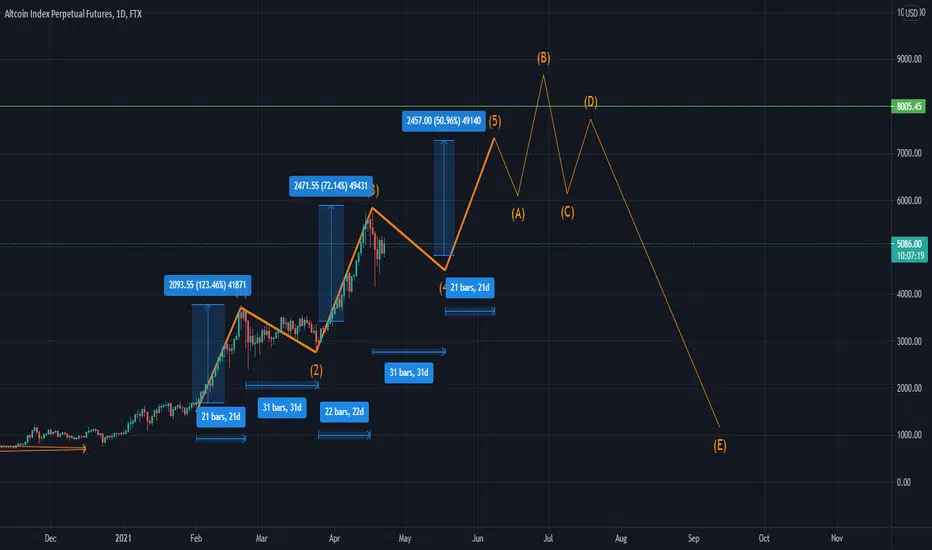
Can Alt Coin Fly Once Again ?If I use 3 drive pattern in this Trend, I found altcoin can go up 1 more and get a correction. This Correction will go to wave 2 of the Elliot Wave Theory
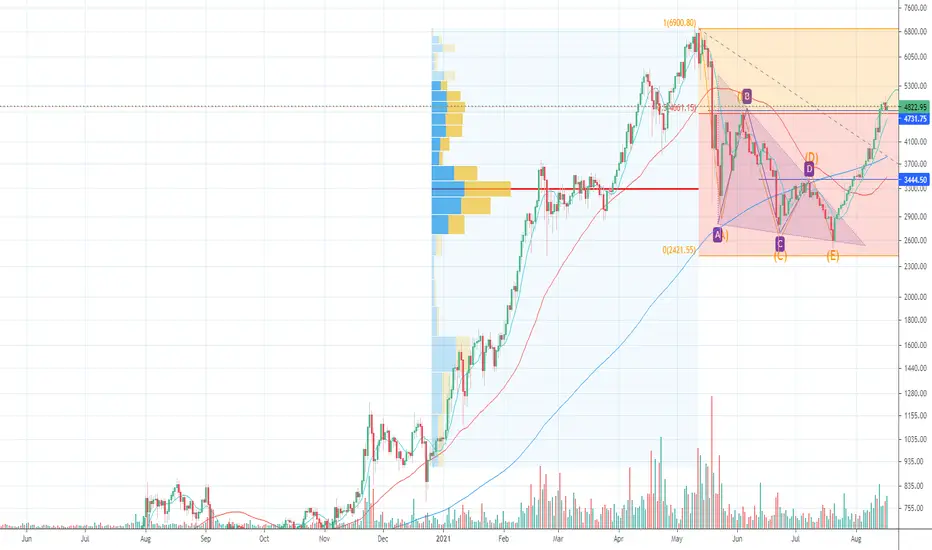
Altcoin Index is forming for another rallyHigher level 4th wave is still in formation and based on FTX's FTX:ALTPERP will be in accumulation in the next a few weeks.
I expect the next wave will start around August.
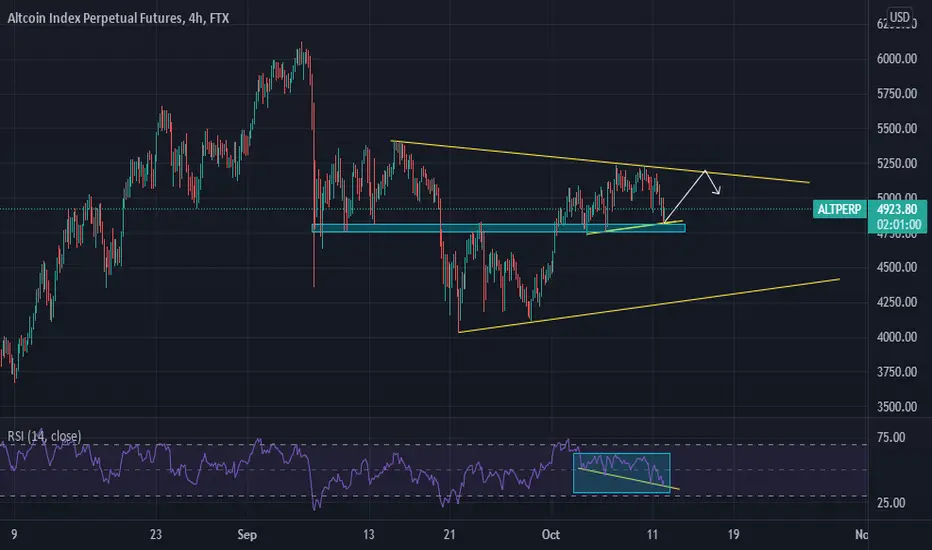
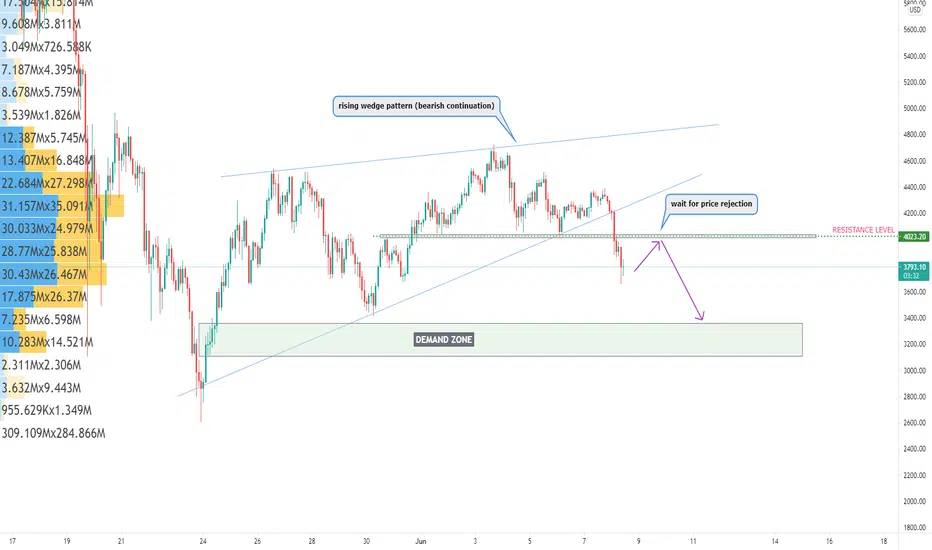
Altcoin Index Forecastcurrently, we are seeing price formed a rising wedge pattern that indicates price might continue its bearish trend, wait for decent price rejection on resistance level if you want to short this asset. good luck traders!
**Disclaimer** the content on this analysis is subject to change at any time without notice and is provided for the sole purpose of assisting traders to make independent investment decisions.
Traders!! if you like my ideas and do take the same trade as I do, please write it in a comment so we can manage the trade together.
_____________________________________________________________________________________________________________________
Thank you for your support ;)
GWBFX
alts relief rally on dailydaily yes, weekly still down, so basically you will make money coming weeks on alts but be careful for weekly pattern

Alts need to Bounce from Here!It's more likely than not, but if not then we will unfortunately retrace much lower

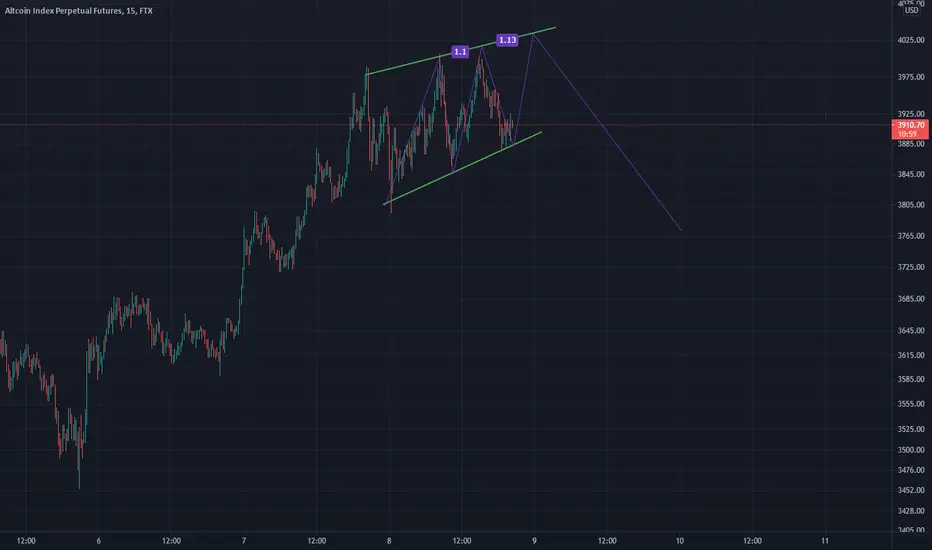
ALTPERP - Next impulse might be on the doorAlcoin index breaks the trendline and makes a small flag above, clear indication of continuation to the upside
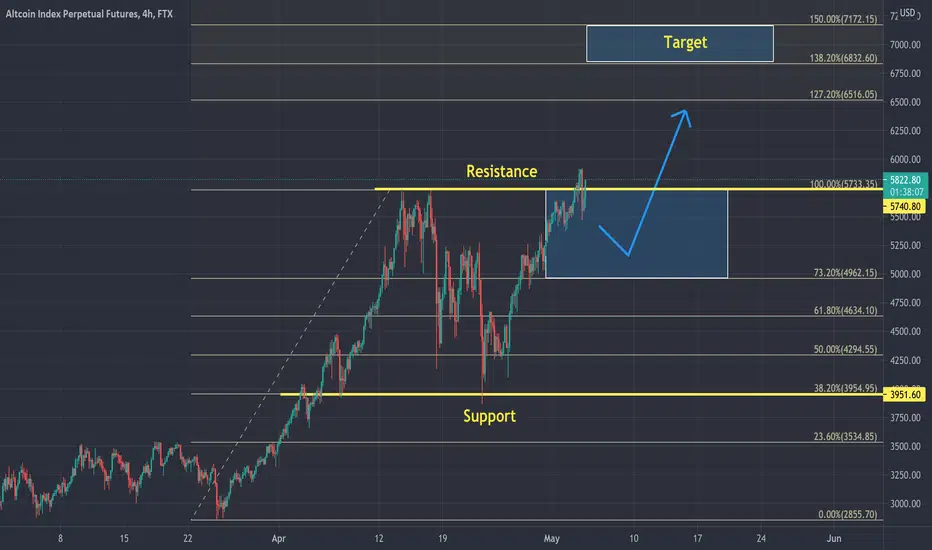
Bulls Price is currently over resistance line,
If it doesnt go straight up to higher price it will first go into Consolidation within 73-100 of the Fibonacci retracement before going up.
Target is 138-150 of Fibonacci retracement (blue box)
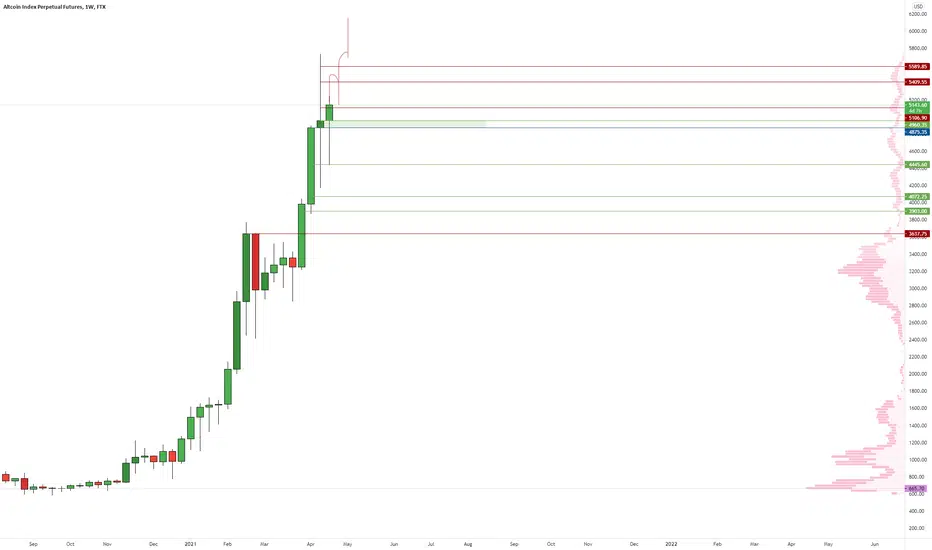
Altcoin are going to flyOn the weekly, there wasn't even a red candle during crypto history's greatest liquidation.
The Power of Relative AnalysisGood morning guys,
I am going to explain here how to evaluate timing for any asset (crypto, stock, index), it can be extrapolated to any of them. Based on Technical analysis, Relative Analysis and Market timing:
Technical Analysis:
If you 're looking to buy an asset you can have a look at the chart itself, which will provide you a very good idea of the timing for buying it.
For that, you will use Moving Averages (21,50,200) depending on your timeframe, and you will also use other indicators such as RSI, MACD or SO .
If you want to give an extra boost to your technical analysis you can use Ichimoku, Pitchfork...
But in the end, less is more. Try to focus on 2-3 indicators and master them, it will be easier and more profitable than having lots of indicators.
From my experience, I use moving averages (21,50,200), MACD or RSI for market momentum and Fibonacci for retracement levels.
The most popular indicators usually are the most important, because there're the most used by traders and investors.
But sometimes that's not enough, sometimes you need to reassure with other tools what you see in a single chart...
Relative Analysis:
For example, if you want to buy a stock let's say $AMZN you can look at the chart but you can also have a look at the index which is listed in, in this case $NASDAQ100.
So you can see if the index itself is bullish or not compared with the stock. But what if I told you that you can make a ratio plotting both charts in only 1 chart.
Then you could see a ratio $AMZN / $NASDAQ100, where if the chart goes up it means that $AMZN is doing better than $NASDAQ100. And if it goes down, $NASDAQ100 is doing better than $AMZN.
So you can see now if Amazon is bullish itslef as a stock and if it's doing better than the index itself and evaluate new resistance support zones in relation to Nasdaq100.
As an example, if you consider Amazon about to do some big move, e.g breaking a triangle pattern, you can see if the relative analysis shows you some resistance against its index, so probably it will break the triangle on the downside.
In order to do this in Trading View, you should go to the search bar and write: NASDAQ:AMZN / CURRENCYCOM:US100 ; You've to manually put the slash and then search for the next value.
Other indicators:
If you surf the internet, you will find Fear & Greed indicators, telling you the market sentiment. You can also find market momentum simple indicators as well as Sentiment Surveys.
In reference to cryptos, you can find as wel Fear & Greed indicators (0-100) speedometer and Altcoins-Bitcoin Season indicator.
I'll leave here some links to these indicators:
money.cnn.com
alternative.me
www.blockchaincenter.net
stockcharts.com
www.aaii.com
I'll also link to this publication a couple of ideas regarding relative analysis NASDAQ/RUSSELL + BTC/GOLD published weeks ago.
Hope it's more or less clear. Don't hesitate to ask me any questions regarding the relative analysis or any other topics.
p.s: I did not talk about fundamental analysis because in my opinion chart graphs speak out loud, however you have to do your own research on each company. Fundamental analysis is another tool that we have to use to complement our analysis, specially if you're a long term investor. I am not diminishing it.
p.s.2: In the grapgh I explain Altcoin vs BTC index but as I previously said you can use it in any pair of your desire. e.g: Dash / Monero, BTC / ETH, Tesla / NIO...
Good luck everoyne and take care!
Cheers,
