Arbitrum 1,322% Profits Potential · Easy · Crypto is Going Up!This will be intense, truly intense. Arbitrum will perform one of the strongest bullish waves in the entire market. Just one red session and we are back up, back green and ready to move. It will be huge.
This is a big project and yet, we have a standard, easy target, around 1,322%. Such huge potential for growth and there is no doubt now, 100% certainty; you can bet your house on it. We are going up.
When the market goes down, it is unforgiving, it gives no break. It goes down and down and down long-term.
When the market goes up, it is unforgiving, it gives no break. It goes up and up and up, many times higher and much more stronger than any previous bearish wave.
So the market is biased in favor of going up. Just as new all-time lows can be hit on a crash, new all-time highs will be hit during a major bullish impulse. Mark my words.
We are not talking about just "another bullish wave." Not just an "advance." We are talking about the strongest, biggest, longest, exciting and highly profitable bullish phase the Cryptocurrency market has yet to offer. We are talking about exceptional exponential growth. We are talking about a bull market like nothing you've seen before.
Get ready because Crypto is going up.
Namaste.
ARBUSDT trade ideas

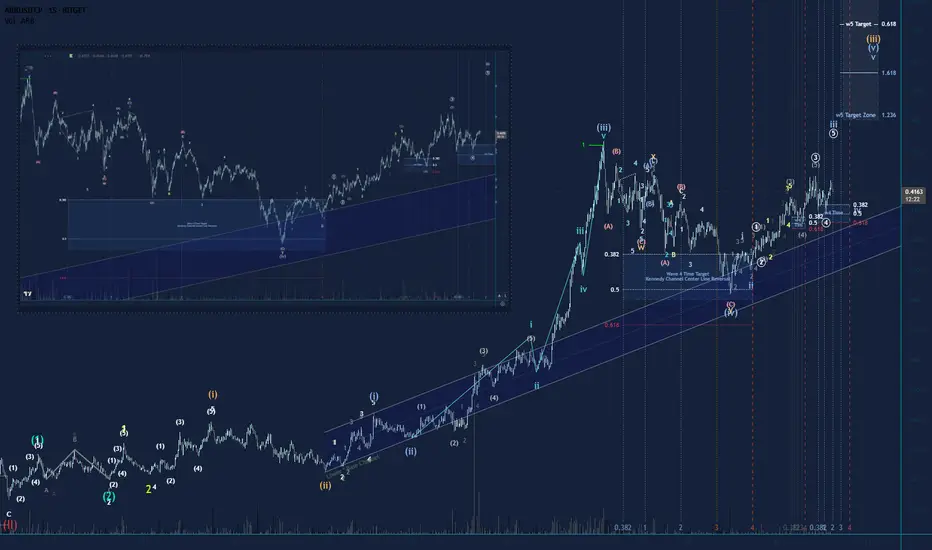
Multiple Nested Wave 3s on Arbitrum! Super Bullish!!🧙♂️I have an Elliott Wave count to share with you showing a super bullish Triple 1,2 in the 3rd wave of the Red impulse playing out. Meanwhile, we are currently in the third wave of the 5th wave of the Blue impulse, which contains in itself more nested waves in the form of a triple 1,2. Chart is shown on the 15 min TF, but I included a pic for viewing the LTF subwaves on the 3 min TF. Not financial advice as I am still a student of the wave principle. Happy trading! 🌊🏄♂️
ARB - Breakout will break the market- Arbitrum is one of the fundamentally strong token on ETH L2.
- After back to back crashes finally we are seeing some reversal from the bottom
- A breakout from the local resistance would push the arb price further, we need to wait till the breakout to enter the trade.
Entry Price: 0.5010 (after breakout)
StopLoss: 0.3169
TP1: 0.6300
TP2: 0.7698
TP3: 1.2297
TP4: 1.7566
TP5: 2.3943
Max Leverage: 5x
Don't forget to keep stoploss
Cheers
GreenCrypto
ARBUSDT Ready to Fly? Strong BreakoutARBUSDT has just completed one of its most critical technical phases in recent months — a clean breakout from a medium-term descending trendline that has been suppressing price since December 2024.
📌 Pattern and Price Structure Analysis:
🔹 Descending Trendline Breakout:
After months of downward pressure, ARBUSDT has finally broken above a long-standing trendline. This isn't just another breakout — it's a strong structural signal indicating a potential trend reversal.
🔹 Well-Defined Accumulation Zone:
A solid consolidation base formed between $0.30 - $0.37, highlighted in yellow, serving as a key demand zone. This area aligns perfectly with the Fibonacci retracement levels:
0.5 = $0.3679
0.618 = $0.3407
0.786 = $0.3019
This confluence of support suggests smart money accumulation before the breakout.
📈 Bullish Scenario (High Probability):
If price holds above the recent breakout zone ($0.45–$0.48), the bullish structure remains intact and a multi-level rally may unfold.
🎯 Bullish Targets:
1. First Target: $0.6502 — immediate horizontal resistance.
2. Key Target: $0.7838 — major resistance and previous rejection level.
3. Psychological Level: $0.9142 — pre-breakdown price zone.
4. Maximum Extension: $1.1903 — a potential target if a macro bullish wave develops.
📌 Look for higher lows (HL) and higher highs (HH) structure to confirm sustained bullish momentum.
📉 Bearish Scenario (If Breakout Fails):
A drop back below $0.45 would weaken the bullish outlook.
If the price slips below $0.3679 and loses the 0.618 Fib level at $0.3407, expect a deeper retracement toward:
$0.3019 (0.786 Fib level)
$0.2421 (previous macro low and key support)
🚨 Failure to hold the breakout level could trigger a bull trap, especially if accompanied by declining volume.
🧠 Additional Technical Notes:
Volume increased during the breakout, adding reliability to the move.
Potential formation of an inverse head and shoulders pattern within the base (still early but worth watching).
Momentum indicators like RSI and MACD (not shown) are likely to support the bullish breakout — watch for divergence confirmation.
🧭 Conclusion:
ARBUSDT stands at a critical juncture. The breakout from a long-standing downtrend coupled with a strong accumulation structure gives bulls a tactical edge. However, it must hold above key levels to sustain the momentum.
Smart traders may consider strategic entries on minor retracements while keeping risk in check below the golden pocket zone.
#ARBUSDT #CryptoBreakout #AltcoinReversal #TechnicalAnalysis
#BullishSetup #TrendlineBreakout #FibonacciLevels #CryptoTrading
#Altseason #CryptoSignals
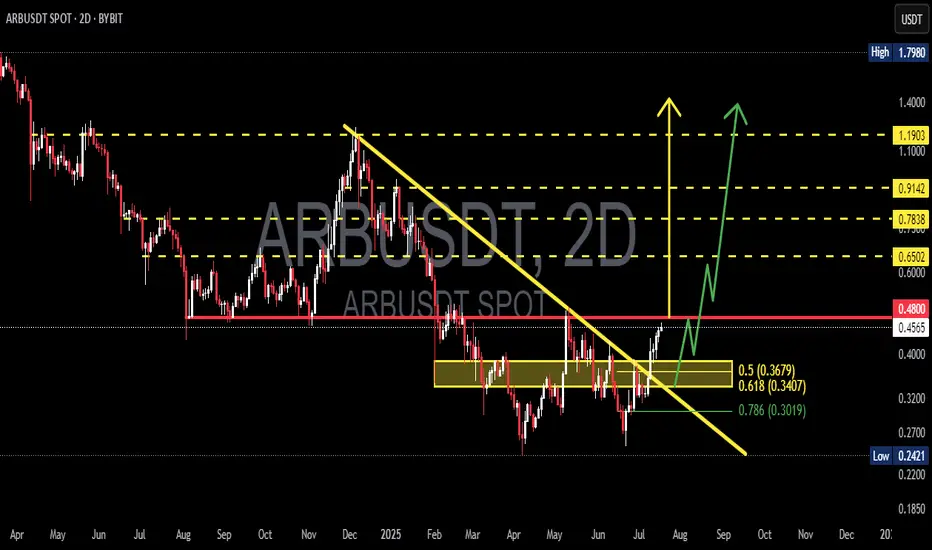
ARB/USDT Breaks Downtrend – Major Bullish Reversal in Play!📊 Technical Analysis (Daily Timeframe)
ARB has officially broken out of a long-standing descending trendline that has defined its downtrend since late 2024. This breakout, supported by strong demand at key Fibonacci levels, could be the start of a major bullish reversal.
🧠 Key Chart Patterns & Structure:
🔸 Descending Triangle Breakout
Originally viewed as bearish, this triangle has instead resolved to the upside — a rare but powerful bullish reversal signal when paired with growing volume and price compression near the breakout.
🔸 Fib Retracement Bounce
Price rebounded precisely from the 0.618 (0.3210) and 0.786 (0.2910) levels, confirming these zones as strong accumulation and liquidity areas.
🔸 Break & Retest Zone at 0.3422 – 0.3210
This golden zone will be key for confirming the breakout. A successful retest here sets the stage for the next leg up.
🔸 Bullish Price Structure Formation
A potential higher low and higher high formation is beginning, which would fully confirm the shift from bearish to bullish market structure.
🟢 Bullish Scenario (High Probability)
If the breakout is validated with a successful retest of the zone:
✅ Short-term Targets:
0.4873 — First major resistance
0.6701 — Mid-range zone with historical confluence
🚀 Mid to Long-Term Targets:
0.8224
0.9216
1.1730
1.2384 — Full recovery back to former highs
🔼 These zones align with Fibonacci extensions and historical resistance areas. Bull momentum can accelerate quickly due to short covering and new buyers entering.
🔴 Bearish Scenario (Invalidation Level)
If price fails to hold above 0.3210, the bullish setup is invalidated short-term:
Breakdown could revisit 0.2910 (Fib 0.786 support)
Below that: full retrace to the December–March demand base at 0.2420
🛑 Key Invalidation Level: Break below 0.3210 with strong selling pressure.
📌 Strategic Summary
ARB has broken its macro downtrend, signaling the start of a new phase.
Holding above the golden pocket zone (0.3210–0.3422) is critical for continuation.
Targets above 0.9–1.2 are realistic if the market sustains its momentum.
Monitor volume and RSI for further confirmation of bullish strength.
🔍 Traders Note:
This setup reflects an ideal blend of trend reversal, Fibonacci support, and breakout confirmation — a textbook setup for swing and positional traders aiming for medium-term upside.
#ARB #ARBUSDT #BreakoutAlert #CryptoTA #TrendReversal #BullishSetup #TechnicalAnalysis #CryptoTrading #FibonacciLevels #DescendingTriangle #AltcoinBreakoutl

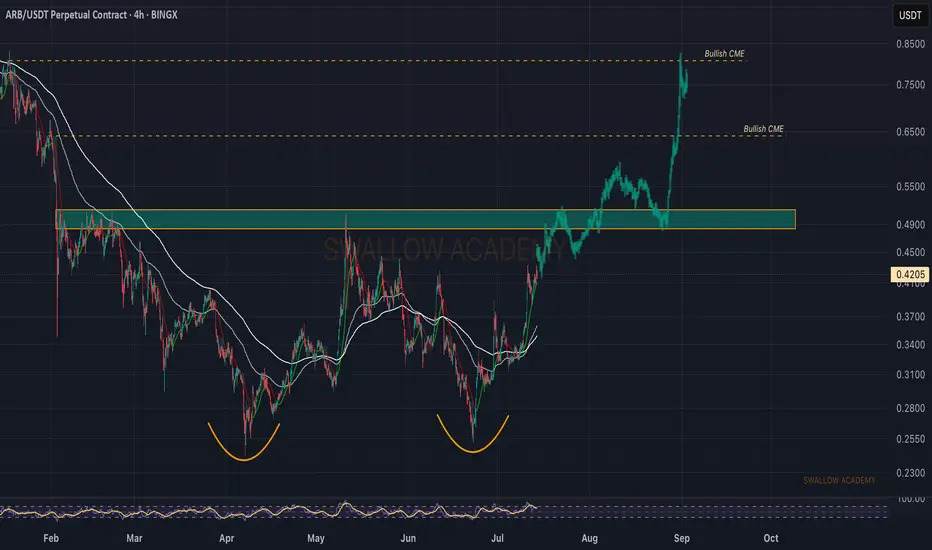
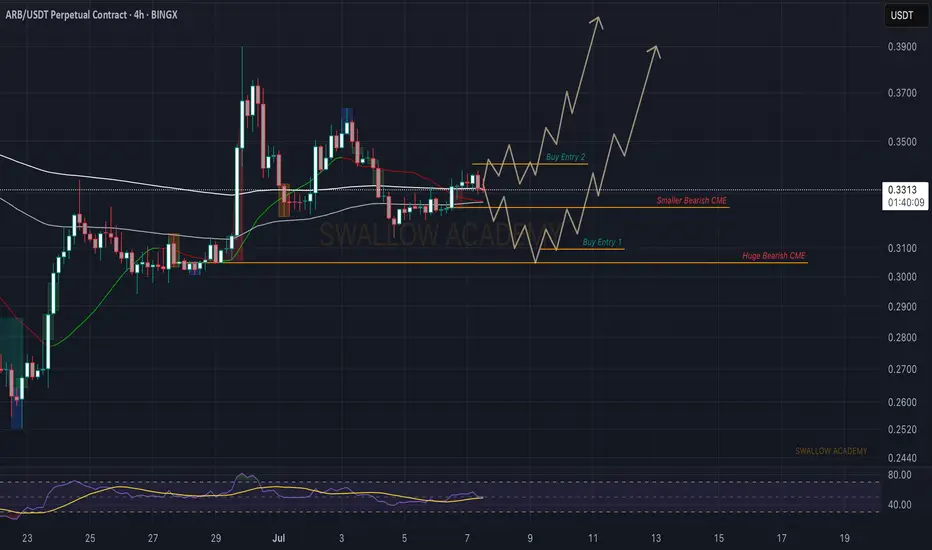
Arbitrum (ARB): Looking For Breakout & Fill of 2 Bullish CMEsARB coin looks good, as the price is slowly approaching the major resistance area where we are going to look for a breakout. As soon as we get the breakout, we are going to aim for the fill of both bullish CMEs, which will give us a good long opportunity there.
Meanwhile, catching smaller scalps towards the resistance can also be done.
Swallow Academy
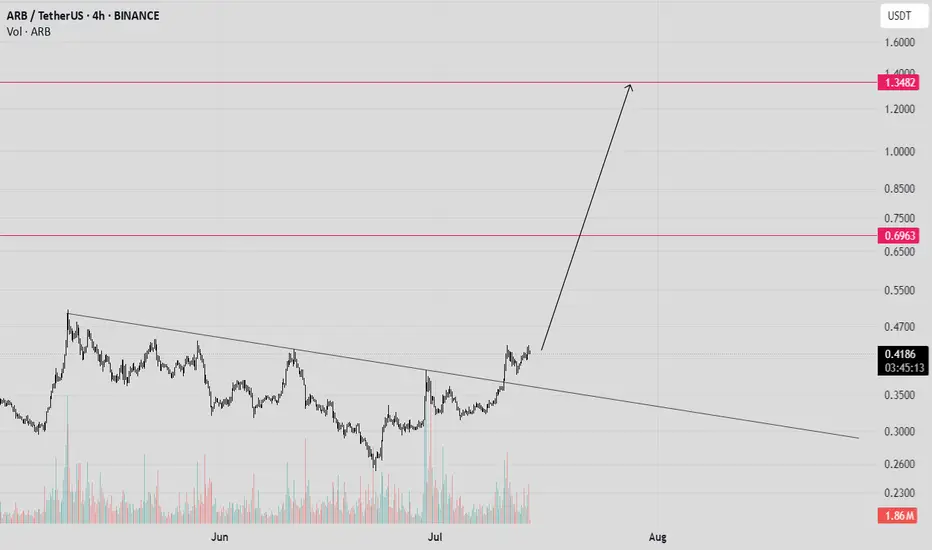
ARB/USDT – Weekly Breakout Setup!Hey Traders!
If you’re finding value in this analysis, smash that 👍 and hit Follow for high-accuracy trade setups that actually deliver!
Massive Falling Wedge Breakout in Play!
ARB just confirmed a breakout from a long-term falling wedge pattern on the weekly timeframe, which has historically been one of the most reliable bullish reversal structures in technical analysis.
🧠 Why this setup matters:
The falling wedge has been forming for over a year, indicating long-term accumulation and compression.
Price has clearly broken above the descending resistance, suggesting a potential shift in momentum.
The structure resembles previous explosive moves, and this could just be the start of a multi-month rally.
🟢 Trade Setup:
Entry: CMP ($0.49) & accumulate on any dips
Targets:
🎯 $0.85
🎯 $1.30
🎯 $2.10+ (Full wedge target)
Stop-loss: 🔴 Close below $0.30
Timeframe: Mid to long term (6–12 weeks or more)
🚀 Bullish Signals:
Weekly breakout candle with strong volume (confirmation pending close).
Market-wide sentiment is gradually turning, and ARB may become one of the leaders.
📌 Final Thoughts:
This is a high-conviction swing setup with a strong reward-to-risk ratio. Keep an eye on weekly close confirmation and market sentiment for better entries.
💬 Let me know your thoughts or if you’re riding this setup too!
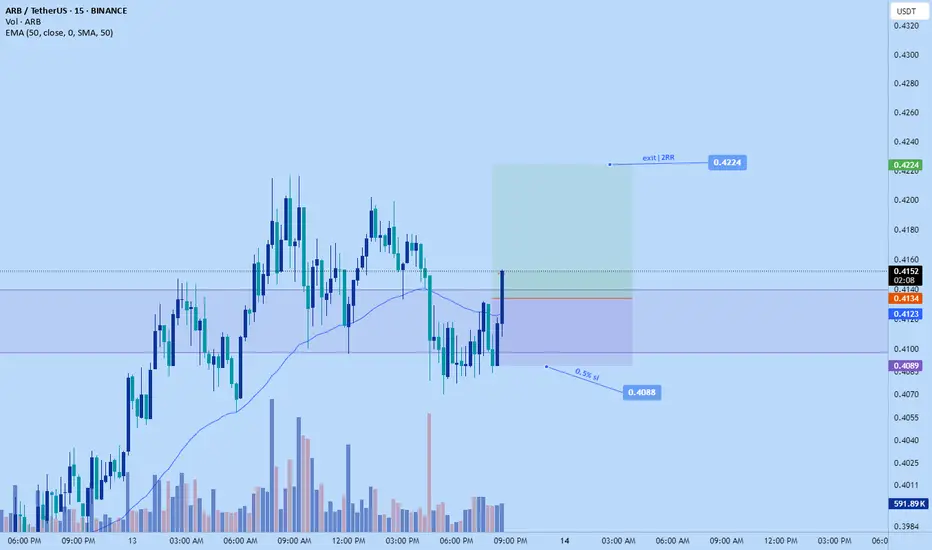
Arbitrum scalp long to $0.4224Just hopped into arbitrum scalp long.
Stop: $0.4088
Tp: $0.4224
Roughly 2 RR
ARB 5X SoonArbitrum
Arbitrum is an EVM-compatible optimistic rollup blockchain platform built on top of Ethereum.
Everything is clear on the chart.
It's time to fly.
I wish everyone abundant profits.
Like and follow
for more.
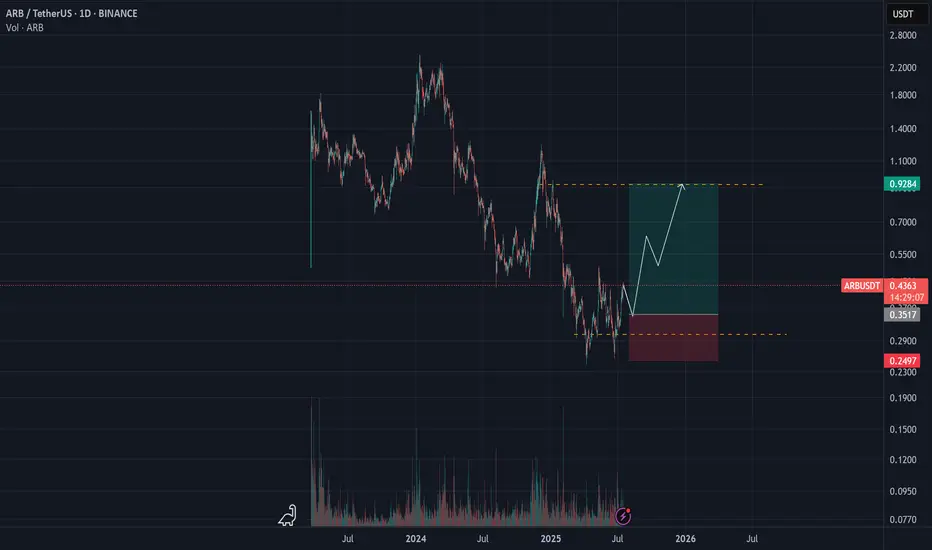
ARB (Arbitrum) Analysis – July 15, 2025After its listing on Binance, ARB has never revisited such low price levels.
Reaching the $0.25 zone has sparked a wave of new investors, confirmed by recent on-chain data.
It also seems that the correction pattern has completed, placing ARB in a strong position for a potential rebound.
📌 While a more conservative entry could be around $0.35,
this current level also offers strong justification for initiating a position.
🎯 Target: $0.90
🔼 That’s a potential upside of approximately 160%.
With proper risk management, this setup stands out as one of the more compelling opportunities in the current market.
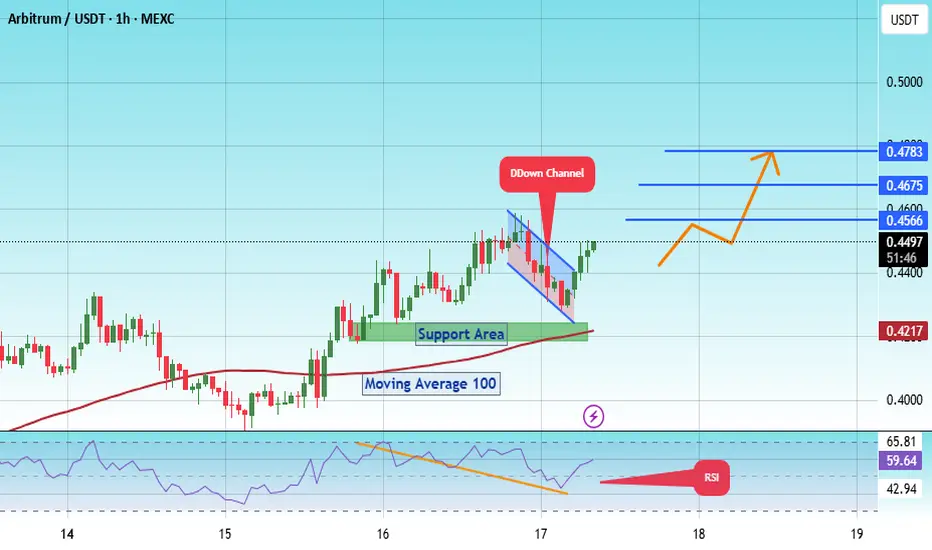
#ARB/USDT Arbitrum scalp long to $ 0.4783#ARB
The price is moving within a descending channel on the 1-hour frame, adhering well to it, and is poised to break it strongly upwards and retest it.
We have 0.4254 from the lower boundary of the descending channel. This support is at 0.0001500.
We have a downtrend on the RSI indicator that is about to be broken and retested, supporting the upward move.
There is a key support area in green at 0.4170, which represents a strong basis for the upward move.
Don't forget one simple thing: ease and capital.
When you reach the first target, save some money and then change your stop-loss order to an entry order.
For inquiries, please leave a comment.
We have a trend of stability above the Moving Average 100.
Entry price: 0.4484
First target: 0.4566
Second target: 0.4675
Third target: 0.4783
Don't forget one simple thing: ease and capital.
When you reach the first target, save some money and then change your stop-loss order to an entry order.
For inquiries, please leave a comment.
Thank you.
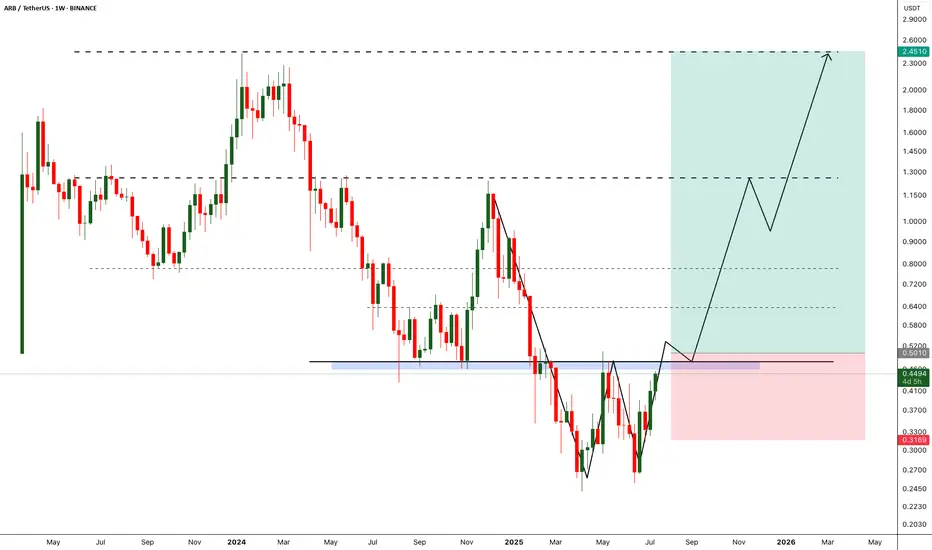
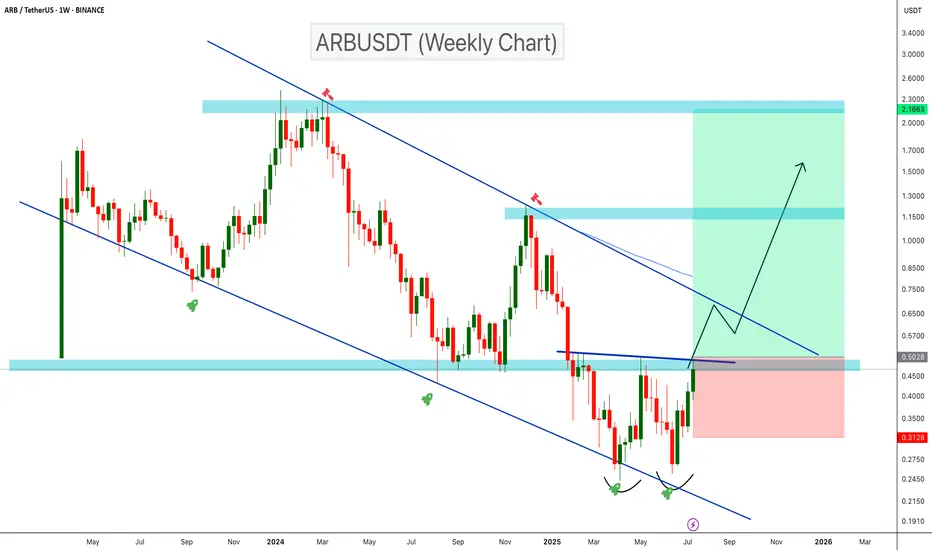
ARBUSDT Double Bottom Signals Bullish Reversal!ARBUSDT is showing a bullish reversal setup on the weekly timeframe after trading within a descending channel for over a year. A clear double bottom has formed near the channel’s lower support, and the price is now breaking above key resistance around $0.50. If this breakout holds, a move toward the upper resistance of the channel and potentially reach the ATH end of this bull run.
Cheers
Hexa
ARBArbitrum
Arbitrum is an EVM-compatible optimistic rollup blockchain platform built on top of Ethereum.
Everything is clear on the chart.
I wish everyone abundant profits.
Like and follow
for more.

Altcoin Season loading?Arbitrum has broken out of the descending wedge, reclaimed the POC and is headed to higher levels. We went long at the breakout and stop loss has been placed at break even.
Not financial advice, do what’s best for you
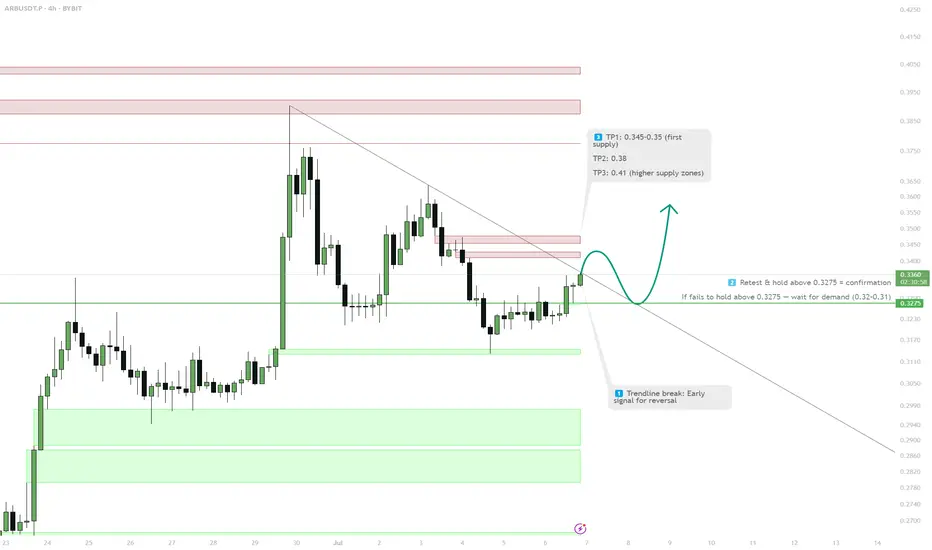
ARB — 4H Supply Break & Trend Reversal1. Watch for confirmed trendline break
2. Retest & hold above 0.3275 for entry
3. TP1: 0.345–0.35 / TP2: 0.38 / TP3: 0.41
4. If fails, watch demand zones below
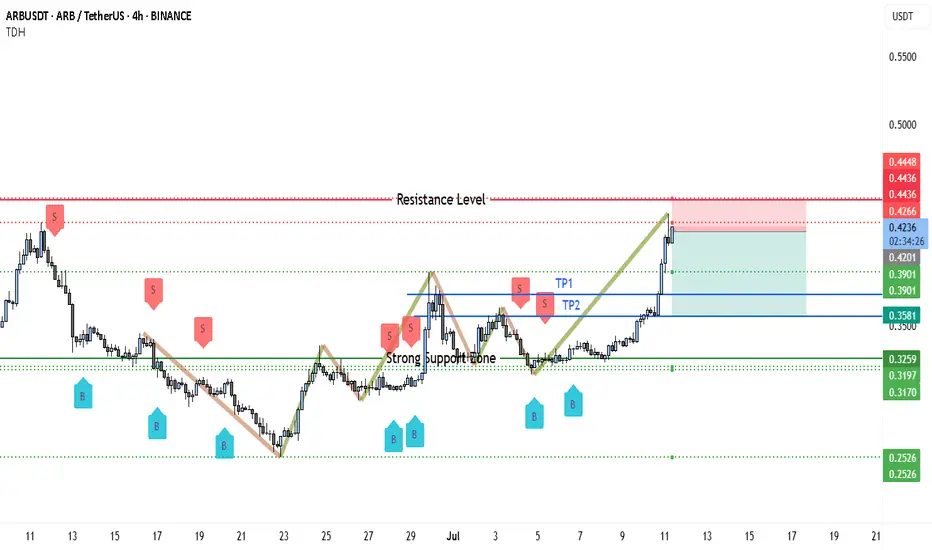
Perfect Short Setup? ARB Enters Bear TerritoryARB/USDT on the 4-hour chart is trading right into a proven resistance zone between 0.4266 and 0.4448 USDT, where the price has reversed multiple times before, as shown by the red “S” markers. This level acted as a ceiling during prior rallies, triggering sharp declines each time it was tested.
The current move up is steep and impulsive, climbing almost vertically from the strong support around 0.3581 without meaningful consolidation. Such rallies often attract profit-taking as traders who bought lower look to exit into overhead supply. The fact that price is already stalling just below resistance suggests momentum is weakening and sellers may soon step back in.
Another reason for a bearish bias is the absence of any strong base or sideways build-up under this resistance area. Typically, a sustained breakout requires accumulation or compression just below resistance; here, price simply surged straight up into it. If this zone holds again, it will likely trigger a pullback back toward the last breakout levels.
A short scenario is attractive because the trade offers a clear invalidation level and clean downside targets. Entering near 0.4266–0.4448 with a stop above 0.4450 protects against a breakout trap while aiming for a retracement first to the 0.3901 zone, which acted as former resistance-turned-support, and potentially deeper to the strong support around 0.3581.
In summary, the chart structure favors a short-term bearish reversal at this resistance. The combination of historical rejection, overextension without consolidation, and evident prior sell reactions makes this level a high-probability area to look for shorts, unless price convincingly breaks and closes above 0.4450 with strong bullish candles.
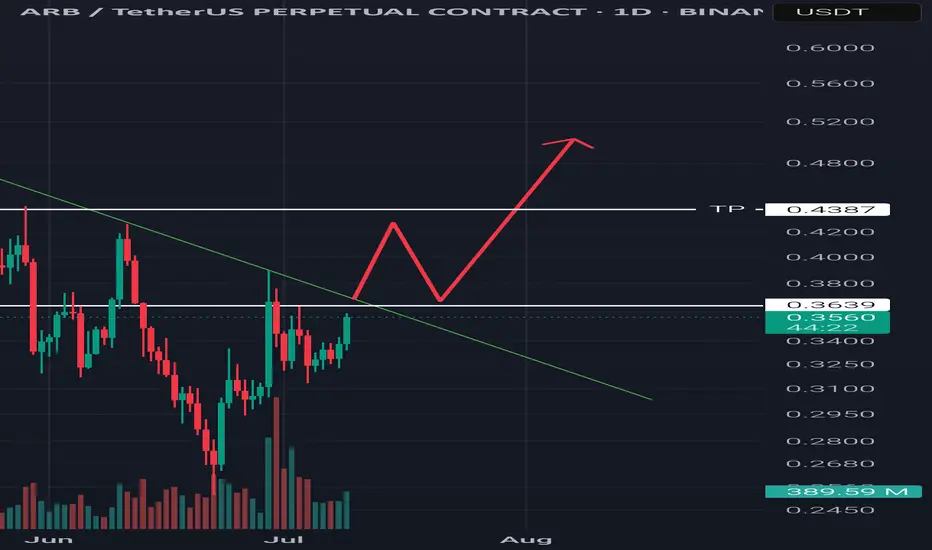
ARB/USDT Analysis – Potential Breakout Ahead?📅 Timeframe: 1D
💰 Current Price: $0.3559 (+5.33%)
📊 Volume Spike: 389.18M
ARB is currently testing a descending trendline resistance that's been respected since mid-May. Price action has formed a base around the $0.35 level and is now showing signs of strength with a recent bullish candle.
📈 Key Levels:
Resistance to Watch: $0.37 - $0.38 (trendline + horizontal level)
Breakout Target: $0.45 - $0.55 zone if the breakout is confirmed
Support: $0.33 - $0.34 range
🧠 Bullish Scenario:
If ARB can break and close above the trendline with volume, a potential retest and continuation move could take price towards the $0.45-$0.55 area.
🛑 Invalidation:
A daily close below $0.33 may signal weakness and delay the bullish breakout.
📌 Watch for:
Break and retest confirmation
Volume confirmation on breakout
RSI and momentum support
📉 Not financial advice. Always do your own research. #ARB #Crypto #Breakout #TechnicalAnalysis #Altcoins #TradingView
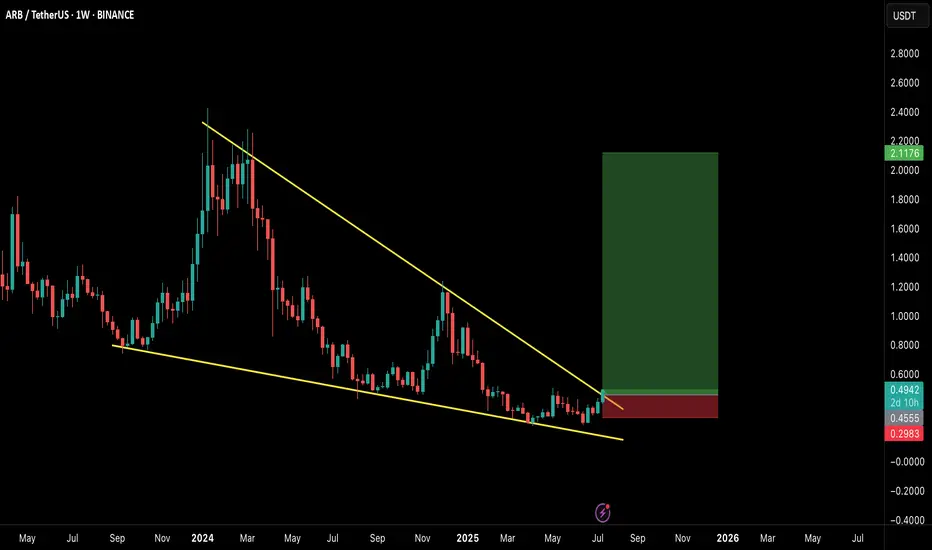
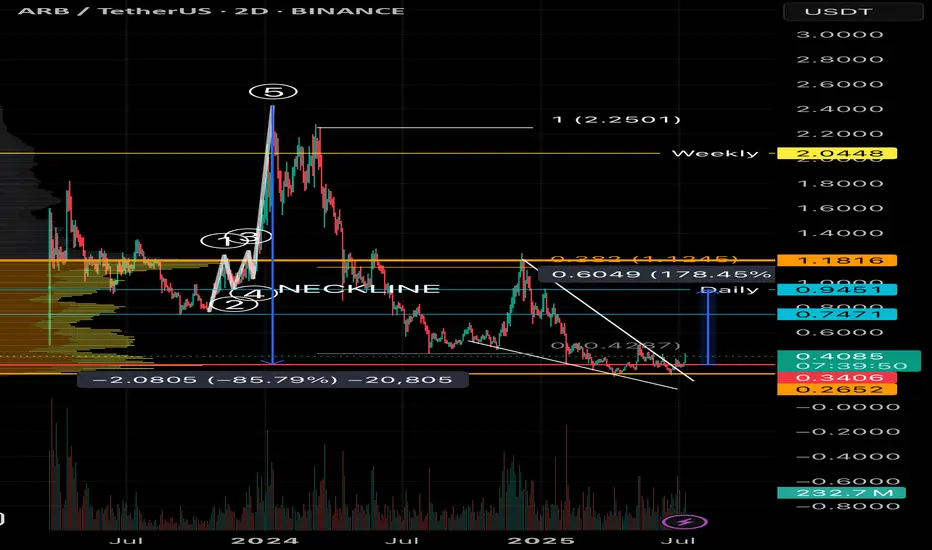
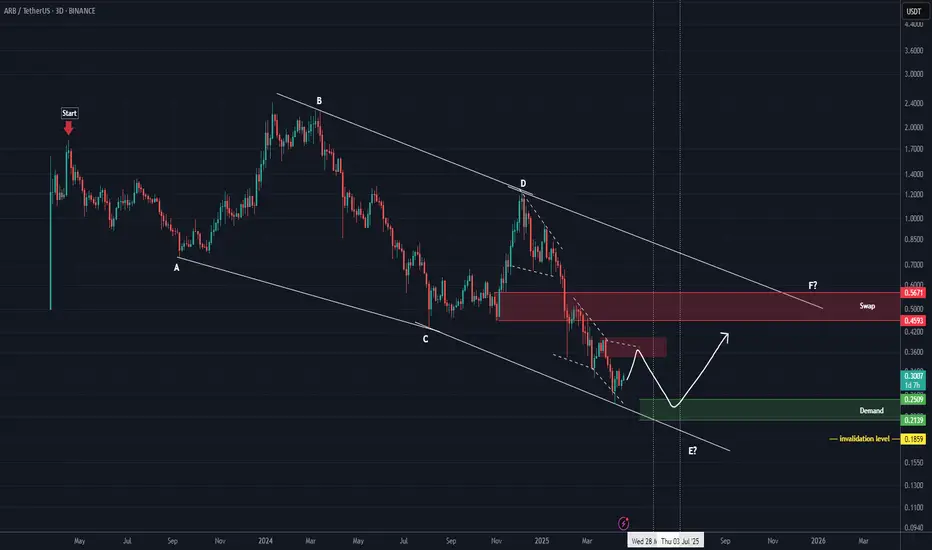
ARB New Analysis (3D)Before anything else, pay attention to the timeframe | it's a higher timeframe and will take time.
The higher timeframe structure of ARB is honestly not that bullish. In this scenario, we’ve considered the entire correction | starting from where the red arrow is placed on the chart | as a diametric/symmetrical pattern.
From a time perspective, wave E has not yet completed, and it is expected to finish somewhere between the two vertical lines. Wave E here is a bearish wave.
If the price pulls back and reaches the green box, we can look for a buy setup in that area.
A 3-day candle closing below the invalidation level will invalidate this analysis.
For risk management, please don't forget stop loss and capital management
When we reach the first target, save some profit and then change the stop to entry
Comment if you have any questions
Thank You
#ARB/USDT Arbitrum scalp long to $ 0.4451#ARB
The price is moving within a descending channel on the 15-minute frame and is expected to break and continue upward.
We have a trend to stabilize above the 100 Moving Average once again.
We have a bearish trend on the RSI indicator, supporting the upward break.
We have a support area at the lower boundary of the channel at 0.4070, acting as strong support from which the price can rebound.
We have a major support area in green that pushed the price upward at 0.3970.
Entry price: 0.4160.
First target: 0.4300.
Second target: 0.4407.
Third target: 0.4451.
To manage risk, don't forget stop loss and capital management.
When you reach the first target, save some profits and then change the stop order to an entry order.
For inquiries, please comment.
Thank you.

Arbitrum (ARB): Looking For Buy Entry | 2 Zones To Keep an EyeArbitrum caught our attention with potential buy zones that we might be seeing pretty soon. We are looking for slight downward movement from here toward the major CME gap, which would be an ideal area for a buy entry, once we form the proper MSB there, so that's what we are looking for.
Swallow Academy
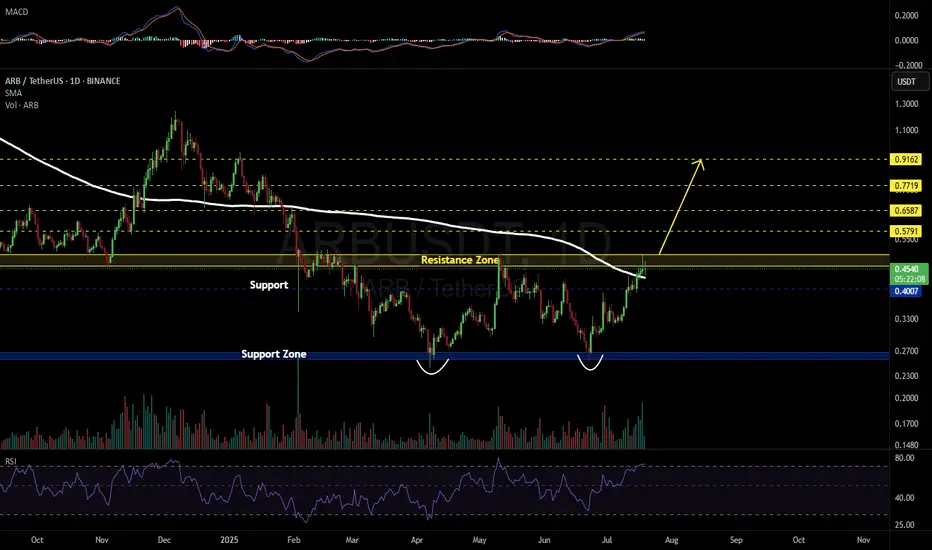
ARBUSDT 1D#ARB has formed a Double Bottom Pattern on the daily chart. This is a bullish pattern, and the price is currently moving above the daily SMA200. However, based on the RSI and other indicators, a pullback toward the support level at $0.4007 is possible. In any case, in the event of a breakout above the resistance zone, the targets are:
🎯 $0.5791
🎯 $0.6587
🎯 $0.7719
🎯 $0.9162
⚠️ Always use a tight stop-loss and apply proper risk management.
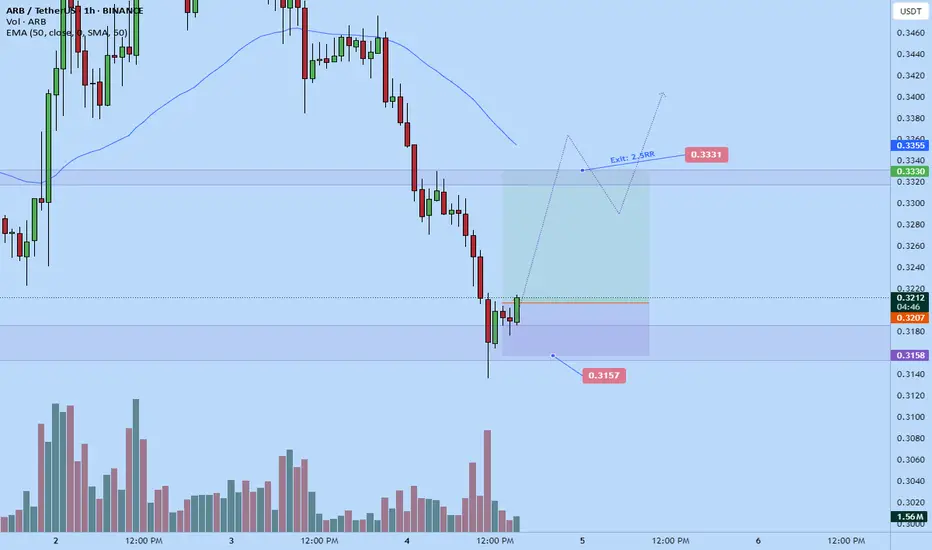
Arbitrum scalp long to $0.3331Just now opened up a scalp long on arb.
2.5RR
Aiming for $0.3331 . The market have fallen relatively low and is a daily demand / support. I think there's a good probability we'll correct back up a bit before end of day.
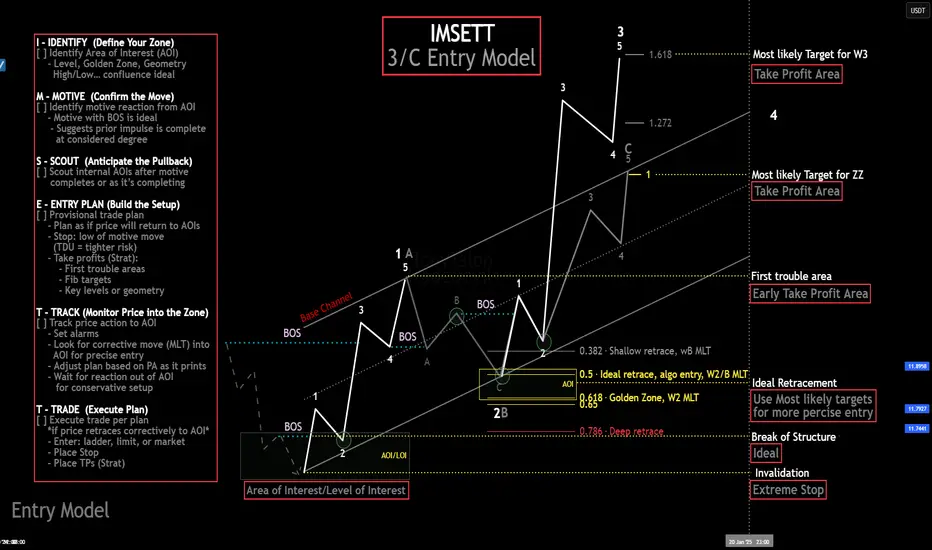
My Ideal Elliott Wave Entry ModelThe IMSETT 3/C Entry Model.
Every trader wants to catch the big moves the ones that pay quickly and decisively. In Elliott Wave, those moves often come during Wave 3. It's the strongest part of the trend, and when you're positioned early, the risk-to-reward is unmatched.
But not every opportunity hands you a clean Wave 3 on a silver platter. Sometimes you’re looking at a Wave C instead. That’s where the 3/C Entry Model comes in. It’s designed to get you aligned with high-conviction moves—whether the market is in a trend or a zig zag.
Here’s the edge: both Wave 3 and Wave C often start the same way—a strong, motive push off an AOI (area of interest), followed by a retracement. That shared structure gives us an anchor. Whether we’re labeling it a 3 or a C doesn’t change the fact that the initial impulse gives us clarity, direction, and a place to manage risk.
That’s what the IMSETT Model is built around:
Identify
Motive
Scout
Entry Plan
Track
Trade
Each step is focused, actionable, and repeatable. You're not trying to outguess the market—you’re reacting to structure, preparing for common behavior, and executing with intent.
I do have a video with a walk through.
This just the way I look for clarity in setups. As with everything in trading, nothing will work every time so do your own research this is not financial advice.
Cheers!
Trade Safe, Trade Clarity.