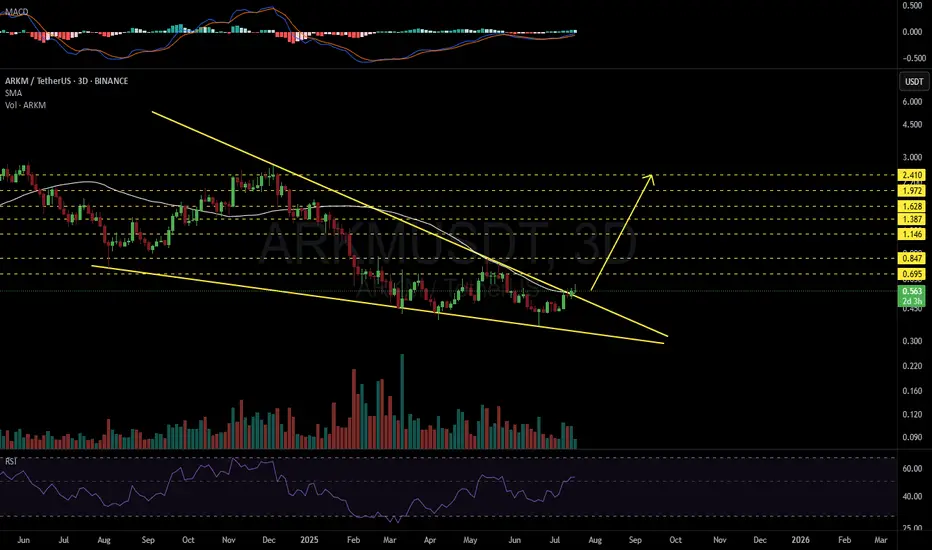
ARKMUSDT 3D#ARKM has broken above the Falling Wedge pattern and the SMA50 on the 3-day chart.
It’s currently testing both the wedge and the SMA50. If it bounces successfully, the following targets are on the table:
Short-term targets:
🎯 $0.695
🎯 $0.847
🎯 $1.146
Mid-term targets:
🎯 $1.387
🎯 $1.628
🎯 $1.972
🎯 $2.410
⚠️ Always use a tight stop-loss and apply proper risk management.
ARKMUSDT trade ideas
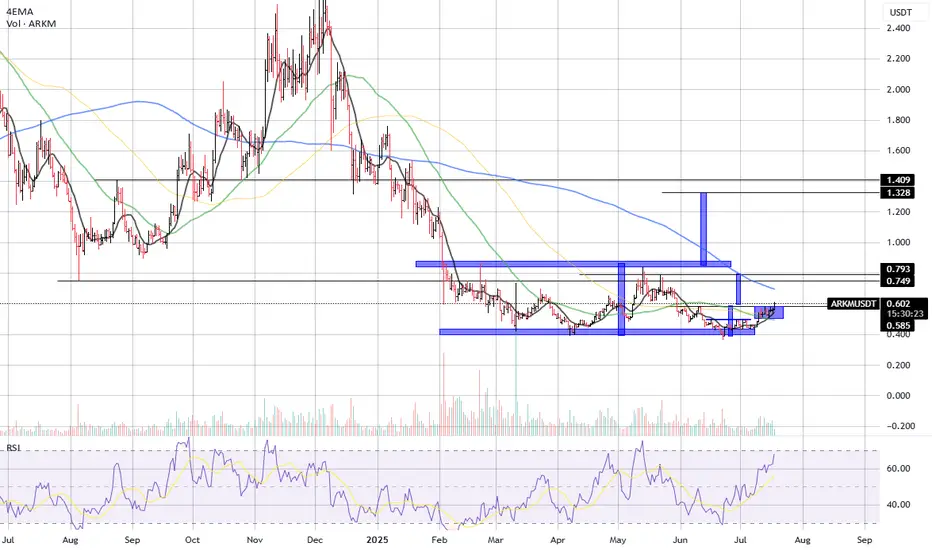
ARKM/USDT – Bullish Continuation Pattern with Upside Potential
Date: July 18, 2025
ARKM/USDT is showing renewed bullish momentum after a prolonged accumulation phase. The price has broken out of a tight range and is now pushing above key moving averages with volume support, indicating a potential trend reversal and upside continuation.
📊 Technical Overview:
Current Price: $0.601
EMA Alignment: Price is currently above the 4EMA, 50EMA, and 100EMA, suggesting growing short-term strength. Still trading below the 200EMA (~$0.695), which could act as resistance.
Structure: Strong breakout from a horizontal consolidation range. The pattern resembles an accumulation zone followed by an impulsive move.
📉 Support Zones:
$0.585 (minor support – recent breakout level)
$0.400 (major accumulation base and demand zone)
📈 Resistance/Target Zones:
Immediate Target: $0.749–$0.793 (horizontal resistance from past price action)
Mid-Term Target: $1.328–$1.409 (projected target based on height of the accumulation box)
📊 Indicators:
RSI: 67.84 – bullish momentum increasing, nearing overbought territory but not yet exhausted
Volume: Volume increasing on green candles – confirms buyer interest and breakout legitimacy
🔍 Chart Structure:
Price spent several months inside a wide consolidation box between ~$0.40 and ~$0.75.
The recent breakout from a smaller mini-range inside the larger zone suggests a renewed push toward upper resistance.
The pattern projection points to a possible move back to the $1.30+ zone in the medium term.
🎯 Upside Projections:
Short-Term Target: $0.749–$0.793
Mid-Term Target: $1.328–$1.409
These levels correspond to past structural resistances and measured breakout moves.
📉 Invalidation:
Breakdown below $0.585 would invalidate the short-term bullish setup.
Falling back into the $0.40–$0.50 zone would indicate weakness and likely further consolidation.
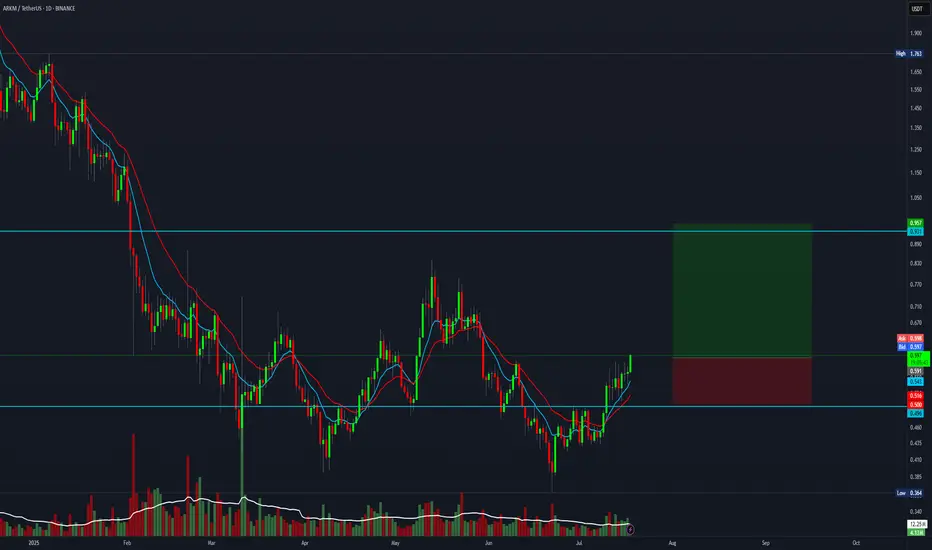
4:1 R:R trade setup for ARKMEverything is pumping right now, and this one also offers a 4:1 R:R setup.
Entry: 0.596
Stop Loss: 0.500
Target: 0.950
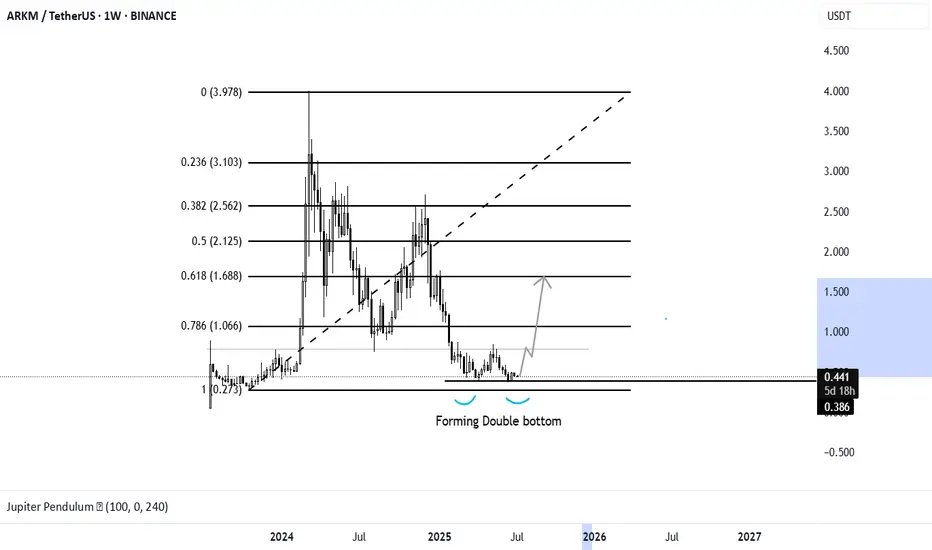
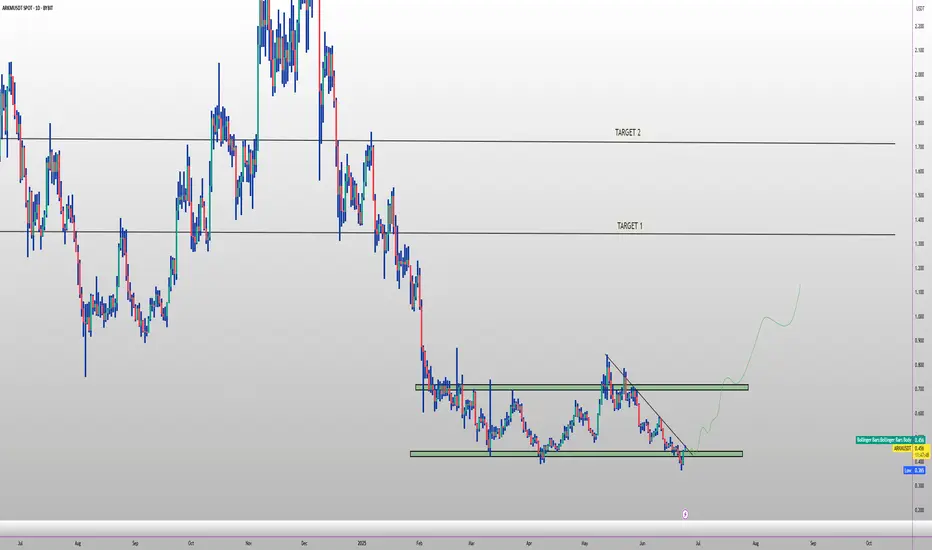
ARKM forming double bottom. Good news for the ARKM long term holders is that ARKM is forming a double bottom where i am expecting it would grow more than 250% till OCT 2025. Its not so complicated when you keep things simple and for long term.
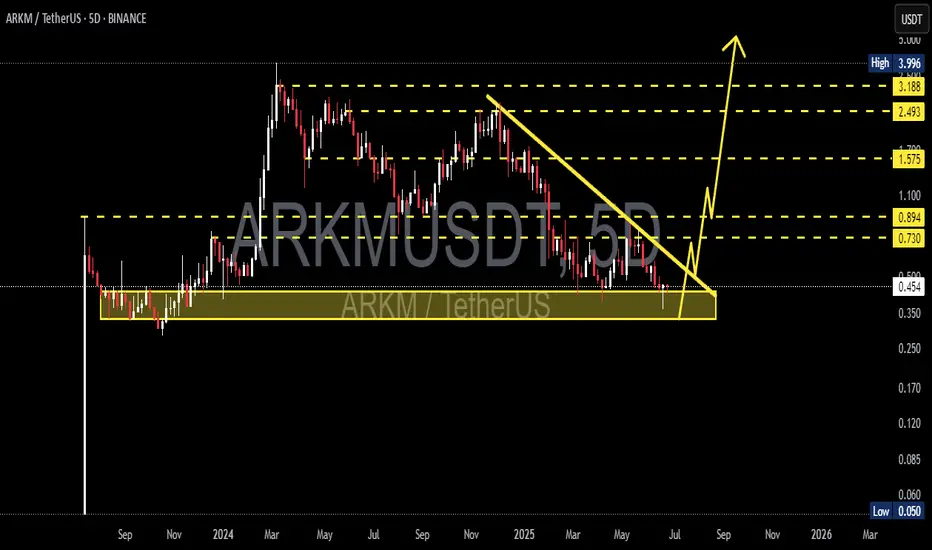
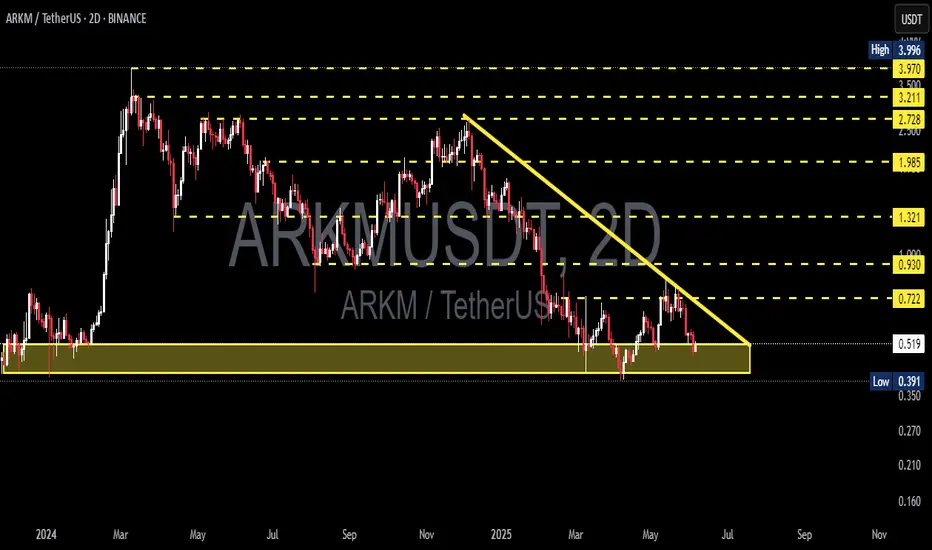
ARKM/USDT – Major Breakout Signal from Multi-Month Accumulation Detailed Analysis:
ARKM/USDT is currently showing a strong technical signal for a potential bullish reversal after a prolonged downtrend from its peak near $3.996. Here are the key insights from the chart:
1. Long-Term Accumulation Zone:
Price has formed a strong horizontal support zone between $0.35 and $0.45 (highlighted in yellow).
Multiple rejections from this zone indicate accumulation by smart money.
2. Descending Triangle Breakout Pattern:
A clear downward trendline has been tested multiple times and is now close to being broken.
A successful breakout could trigger a powerful upward rally.
3. Potential Upside Targets (Resistance Levels):
Target 1: $0.73
Target 2: $0.894
Target 3: $1.575
Target 4: $2.493
Target 5: $3.188
Final Target (ATH): $3.996
4. Potential Trading Strategy:
Aggressive entry: On breakout above the descending trendline with strong volume.
Conservative entry: On retest of the broken trendline, now acting as support.
Stop-loss: Just below the accumulation zone (~$0.30).
5. Market Sentiment:
The market structure suggests a potential bullish reversal is building.
If momentum confirms, this setup has significant upside potential.
🎯 Summary:
ARKM is showing signs of strength as it approaches a breakout from a key descending triangle pattern. A move above the resistance could mark the beginning of a strong bullish trend. Keep an eye on volume and breakout confirmation.
#ARKM #ARKMUSDT #CryptoBreakout #AltcoinAnalysis #TechnicalAnalysis #CryptoReversal #BullishSetup #CryptoTrading #TradingView #DescendingTriangle
#ARKM is ready for an upside move of more than 150%#ARKM is ready for an upside move of more than 150%, and the remaining altcoins are set for a 100% move.
This will be the final upside move—after this, a severe crash will follow, one beyond imagination.
For example, SOL could fall below even $50.
ARKM BREAKOUT WATCH🔥 $ARKM long setup (1 D) 🚀
✅ Entry Zone: $0.44 – $0.41 (triple-tested demand)
🎯 Targets
• TP-1: $0.75 (Jan-25 supply flip)
• TP-2: $1.30 (post-IPO breakdown block)
⛔ Stop-Loss
Daily close < $0.37
📊 Thesis
• Arkham Intel Exchange = world’s first on-chain intel marketplace; >1,300 bounties posted 🕵️♂️
• Intel-to-Earn DATA program pays sleuths in $ARKM, driving real fee demand 🔁
• **AI Oracle** lets anyone query blockchain data with ChatGPT-style prompts 🤖
• Institutional API live – same endpoint Arkham uses internally, now sold to funds & banks 🏦
• Swift pilot: CCIP-style proof-of-concept pipes Arkham labels to TradFi (under NDA) 💼
• Binance Launchpad #32; oversubscribed × 990; 114 k users staked BNB to get $ARKM ⚡
• Buy-back wallet removing 100 k+ ARKM / week from open market 🔥
• Supply fixed at 1 B; 80 % already circulating, no inflation 🟢
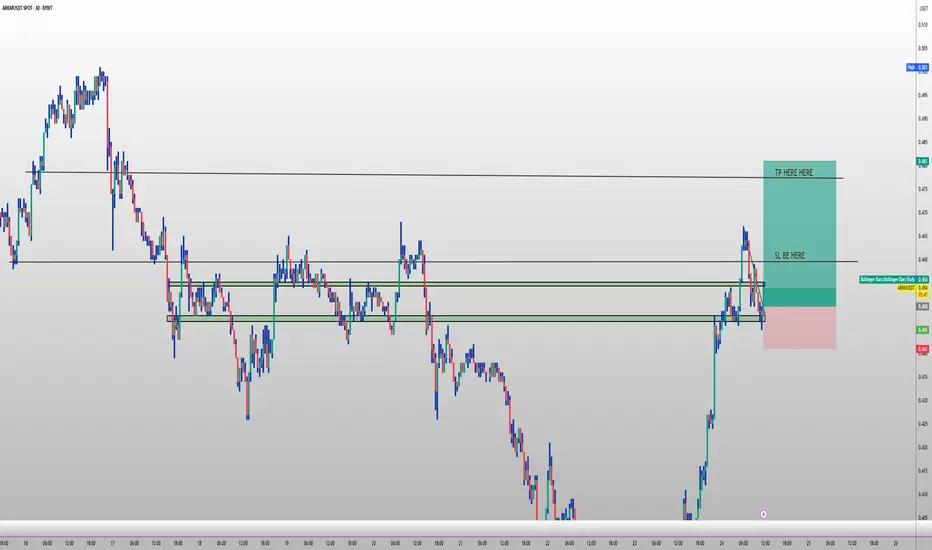
ARKM SCALP 🔥 ARKM Long Setup (30m) 🚀
✅ Entry Zone: $0.4524 – $0.449
🎯 Targets
• TP-1: $0.481
• TP-2: $0.501
⛔ Stop-Loss: $0.441
ARKMUSDT 2D AnalysisARKM ~ 2D Analysis
#ARKM Buy gradually from this support block with a short term target of at least 20%+ from here.
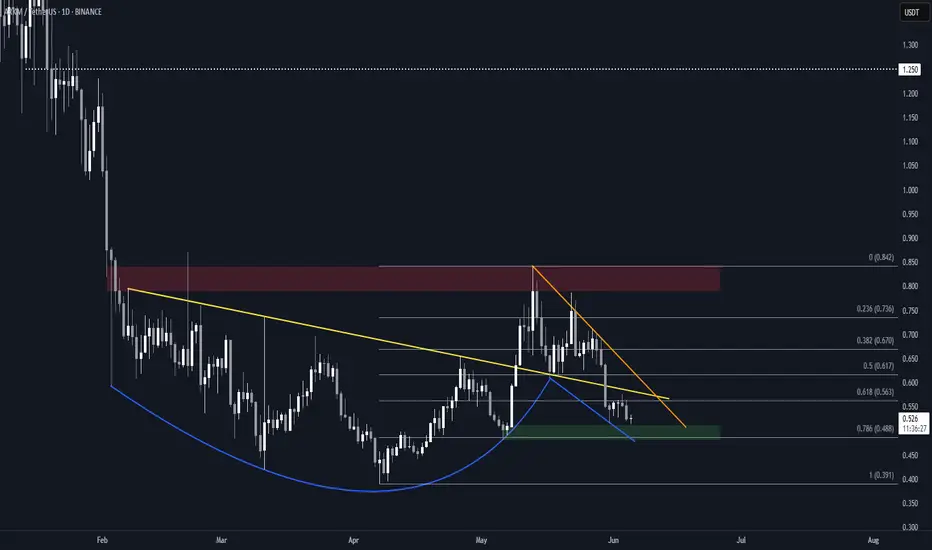
Arkham (ARKM) Structure Analysis (1D)Interesting chart for BINANCE:ARKMUSDT
Apologies for the trendlines mess, but they're all potentially relevant.
Watch for
• Bounce at ~$0.49 (0.786 Fib)
• Break above the yellow and orange resistance trendlines (~$0.57)
These conditions could form a Cup & Handle pattern and lead to a retest of the $0.80-$0.85 supply zone.
If that it broken, it could set the next target to ~$1.25.
Arkm's price may drop more and more.Arkm may provide a good opportunity for long-term buying in the coming months. Most likely in the autumn months.
* The purpose of my graphic drawings is purely educational.
* What i write here is not an investment advice. Please do your own research before investing in any asset.
* Never take my personal opinions as investment advice, you may lose your money.
Arkm can be bearish in short term.It may want to go down to the range of 0.4 to 0.37.
* The purpose of my graphic drawings is purely educational.
* What i write here is not an investment advice. Please do your own research before investing in any asset.
* Never take my personal opinions as investment advice, you may lose your money.
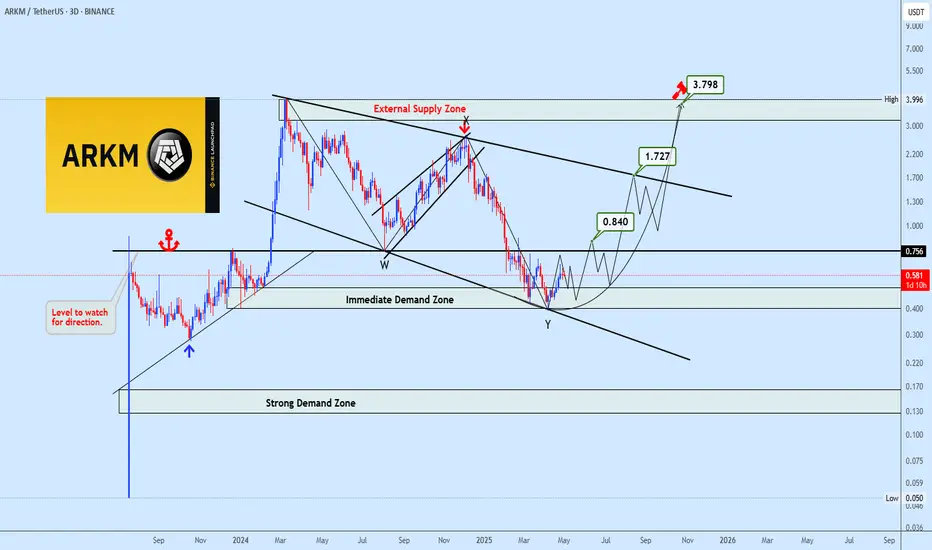
ARKMUSDT Correction Structuring MidTerm RecoveryARKMUSDT has completed a complex corrective structure, terminating near a well-defined immediate demand zone where price action has begun to exhibit basing characteristics. The final leg into this zone coincided with the lower boundary of a descending broadening wedge, further reinforcing this region as a potential accumulation area.
Price is currently stabilizing above this demand zone, with the 0.840 level emerging as a pivotal structural resistance that must be reclaimed for bullish continuation. A successful breakout above this threshold opens the pathway toward 1.727, a mid-range liquidity target, and subsequently to the 3.798 zone, which aligns with the prior external supply zone and confluence of historical distribution.
Directional bias remains bullish while price holds above the immediate demand zone, though the level around 0.756 remains critical for directional validation. Any failure to sustain above this zone could see price cascading toward the lower strong demand region.
ARKM BIAS consistently strong bullish market structure,
high-probability bullish bias. Expect continued upward movement, with any retracements into unmitigated bullish institutional zones potentially offering favorable long entry opportunities.
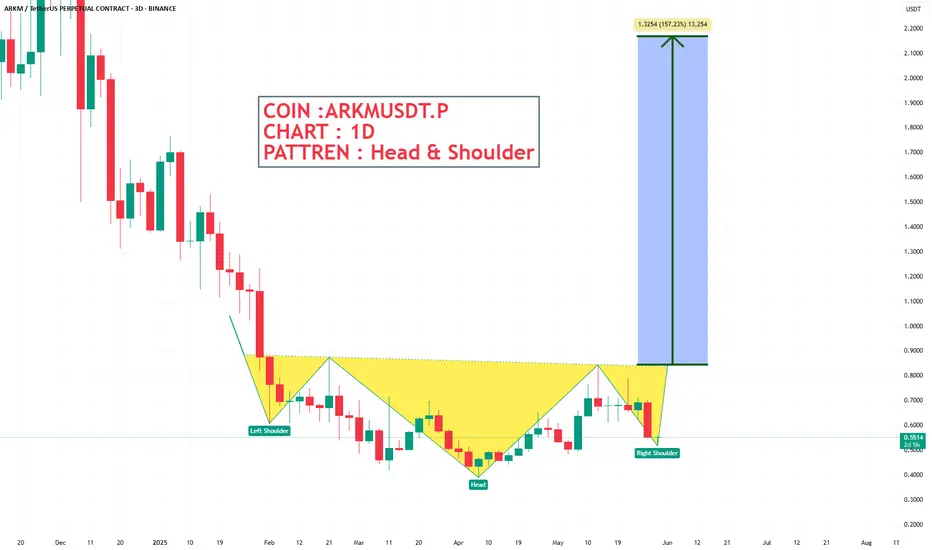
ARKMUSDT.P Make a Head & Shoulder pattren in 3 D chart🛫 COIN : ARKMUSDT.P
🕯 CHART : 3D
📊 PATTREN : Head & Shoulder
🔼 POSITION : BULLISH📈
💵1 Target - $ 0.9050
💵2 Target - $ 1.2669
💵3 Target - $ 1.1550
💵4 Target - $ 1.7910
💵5 Target - $ 2.1685
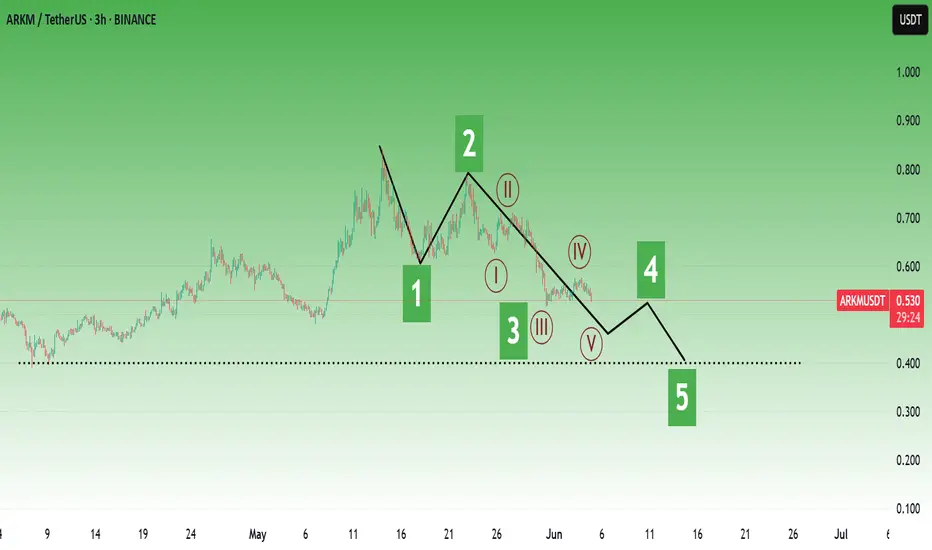
Arkm near term.Possible near term scenarios.
* The purpose of my graphic drawings is purely educational.
* What i write here is not an investment advice. Please do your own research before investing in any asset.
* Never take my personal opinions as investment advice, you may lose your money.
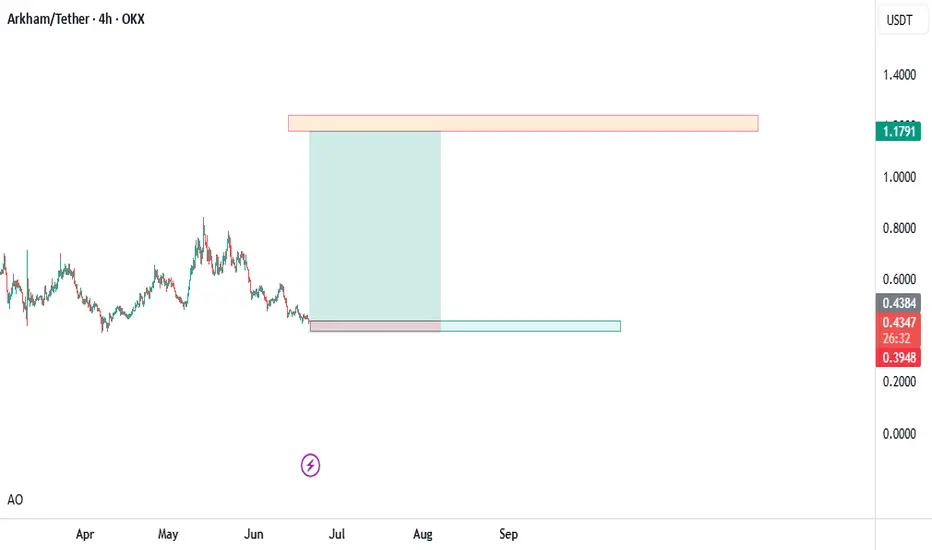
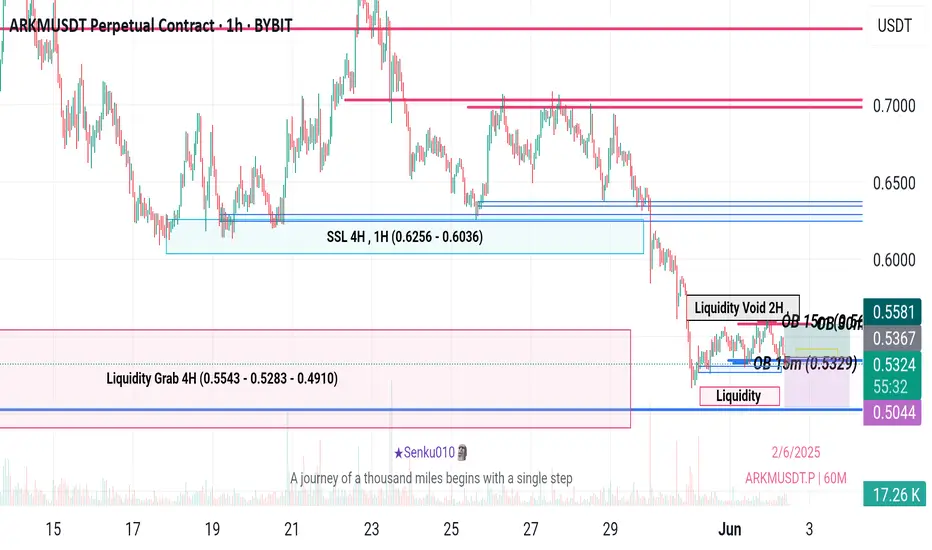
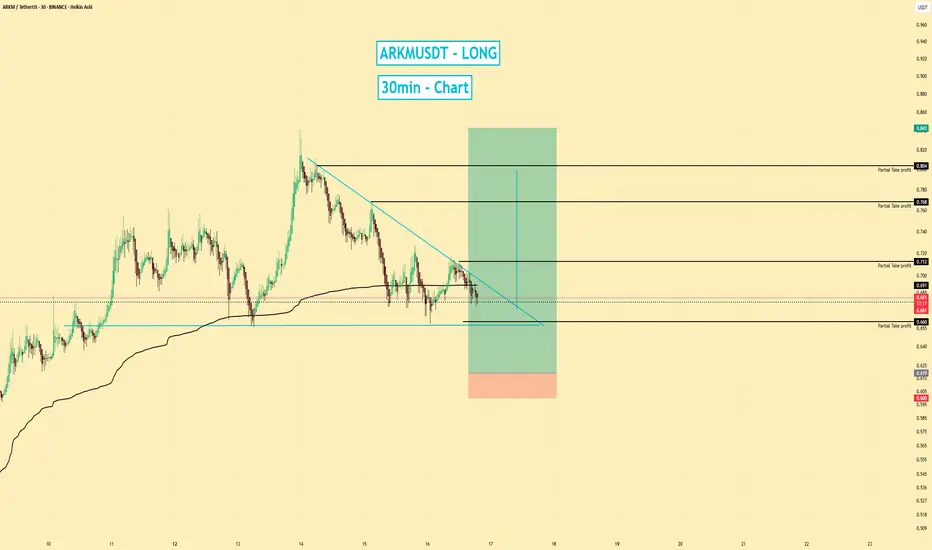
ARKMUSDT | Long Setup | Potential Squeeze | (May 2025)ARKMUSDT | Long Setup | Potential Squeeze on High OI | (May 2025)
1️⃣ Insight Summary:
ARKM is showing signs of potential overleveraged positions building up. While this isn't a high-conviction trade, it could turn into a short squeeze play if key levels hold and open interest continues to rise.
2️⃣ Trade Parameters:
Bias: Long (Speculative Setup)
Entry: Watching current zone for entry (around $0.58–$0.60 range)
Stop Loss: Below the recent low to limit downside on a failed squeeze
TP1: $0.660
TP2: $0.712
TP3: $0.760
TP4: $0.840 (final stretch target if squeeze extends)
Partial Exits: Take partial profits along the way — don’t wait for the top
3️⃣ Key Notes:
This setup is driven by technical structure + open interest dynamics — not fundamentals.
The token has seen consistent spot selling, with many believing it's being offloaded by early holders or insiders.
ARKM belongs to a group of low-fundamental coins often tied to “zero-trending” narratives, where the business model is essentially selling the coin itself.
Still, if leveraged shorts get trapped, this could fuel a strong upward move. It's crucial to manage risk tightly, and stay flexible.
4️⃣ Follow-up Note:
I'll reassess the setup if the price loses the current support zone or if OI drops sharply. Otherwise, this remains a reactive play on market structure and sentiment.
Please LIKE 👍, FOLLOW ✅, SHARE 🙌 and COMMENT ✍ if you enjoy this idea! Also share your ideas and charts in the comments section below! This is best way to keep it relevant, support us, keep the content here free and allow the idea to reach as many people as possible.
Disclaimer: This is not a financial advise. Always conduct your own research. This content may include enhancements made using AI.
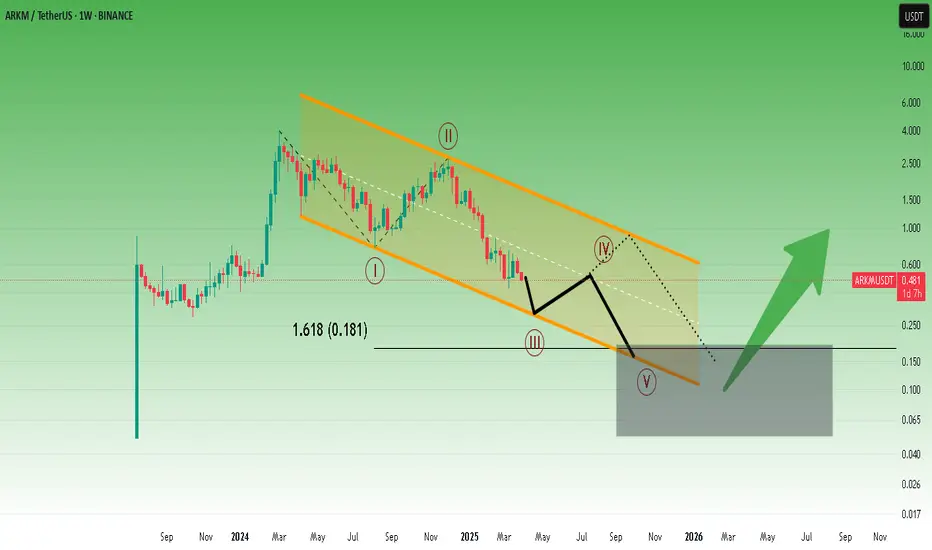
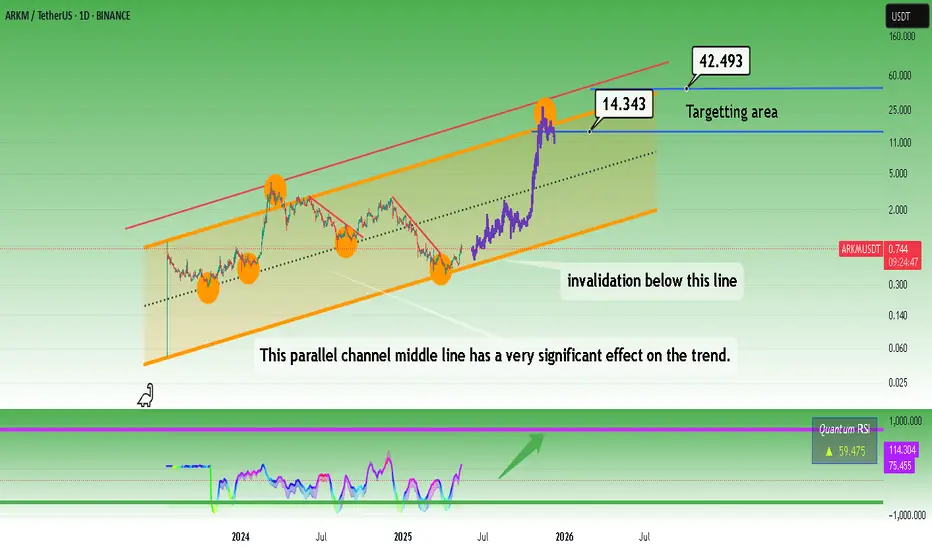
Arkm possible bull market targets.Possible bull market targets and invalidation level. It is obvious that prices have been moving within this channel so far.
* The purpose of my graphic drawings is purely educational.
* What i write here is not an investment advice. Please do your own research before investing in any asset.
* Never take my personal opinions as investment advice, you may lose your money.
High Risk, High Reward altcoinCaught the low on the daily, beautiful reaction to the upside with plenty of room to rip. Possible end of the altcoin bear market, I think this altcoin is primed for a massive run.
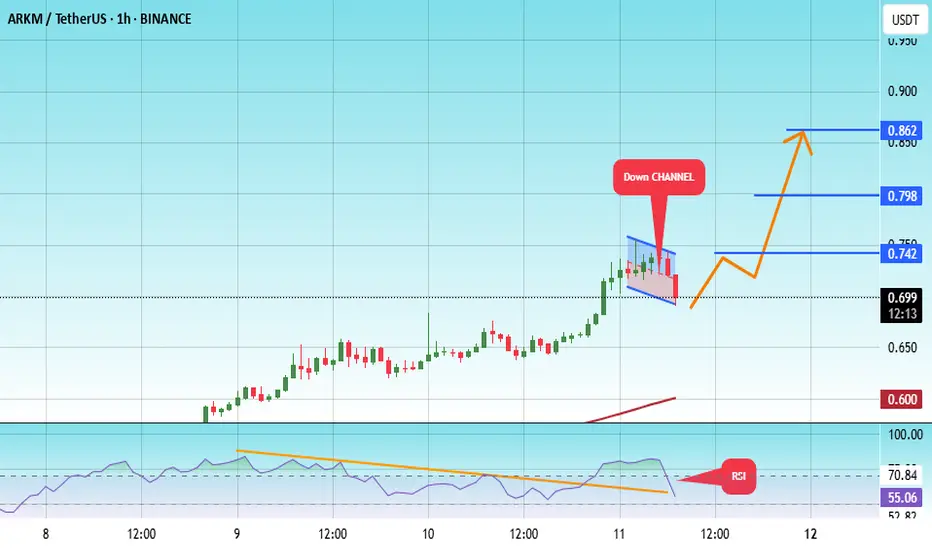
#ARKM/USDT#ARKM
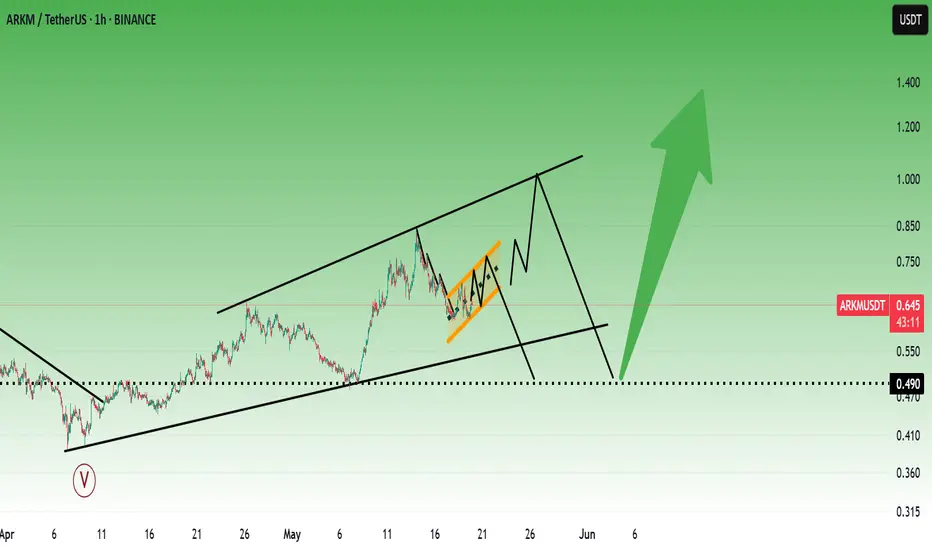
The price is moving within a descending channel on the 1-hour frame, adhering well to it, and is heading for a strong breakout and retest.
We are seeing a bounce from the lower boundary of the descending channel, which is support at 0.690.
We have a downtrend on the RSI indicator that is about to be broken and retested, supporting the upward trend.
We are looking for stability above the 100 moving average.
Entry price: 0.695
First target: 0.742
Second target: 0.798
Third target: 0.862
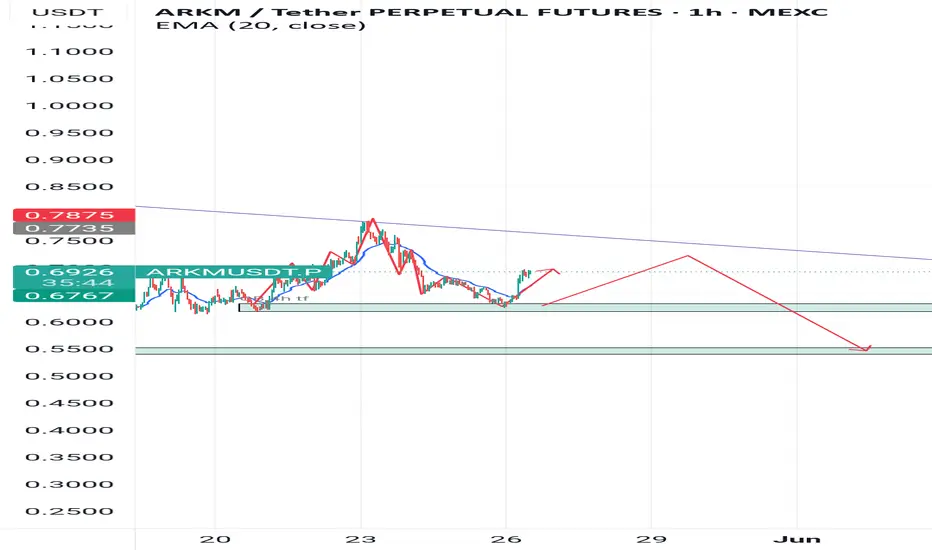
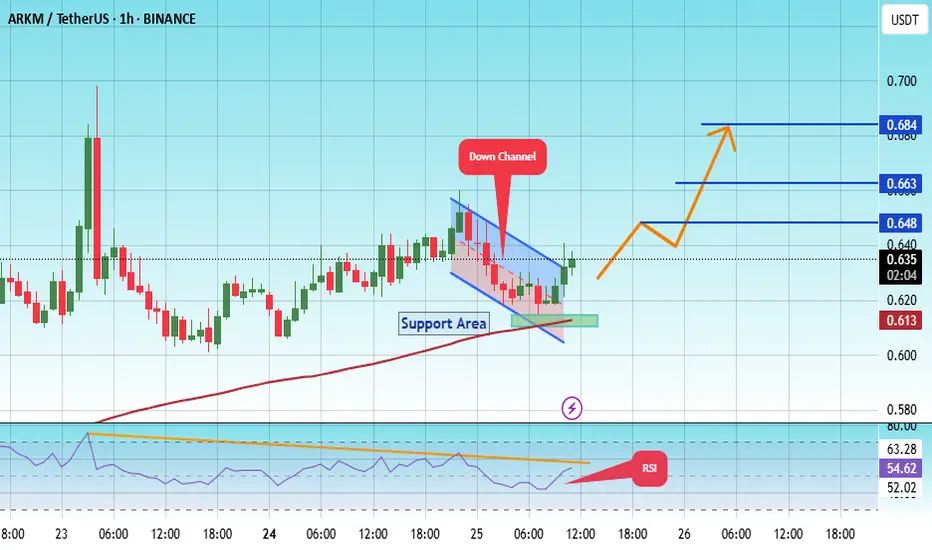
#ARKM/USDT#ARKM
The price is moving within a descending channel on the 1-hour frame, adhering well to it, and is heading for a strong breakout and retest.
We are seeing a bounce from the lower boundary of the descending channel, which is support at 0.612.
We have a downtrend on the RSI indicator that is about to break and retest, supporting the upward trend.
We are looking for stability above the 100 moving average.
Entry price: 0.635
First target: 0.684
Second target: 0.663
Third target: 0.684
ARKM Testing Key Resistance – What’s Next?🔥 ARKM Resistance Alert
📊 ARKM is currently testing a crucial resistance level around $0.74—price action here is key! 🚨
🎯 Watch for a potential breakout or rejection at this level to determine the next move.
⚠️ This is a critical zone—pay attention to how price reacts.
👀 Keep ARKM on your radar—this could be a pivotal moment for the coin!
