TSLA about to put in a huge reversal dayCoinrotator.app signaling higher after a 3 month consolidation.
TSLAC trade ideas
Quick Update : TSLABullish Crossover on the hourly chart at the bottom of the channel.
The action of the last hours is weak as can be seen by the lack f volume.
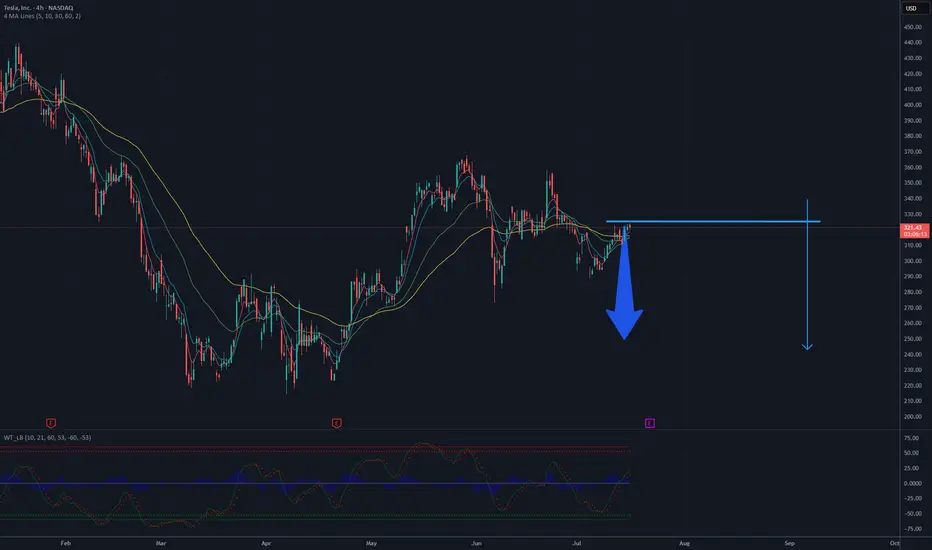
UPTADE TESLA -- 250 USD still potentialTesla is consolidating in a tight range, showing bearish pressure near the lower boundary of the formation. Moving averages (MA 5/10/30/60) are flattening, indicating a loss of bullish momentum, while the Wavetrend oscillator has issued a sell signal (bearish crossover below the zero line). A downside breakout from this range projects a potential move toward the $250 level, as illustrated by the measured move. This bearish scenario gains validity if price breaks below the $315 support level.
Potential TP still 250 USD
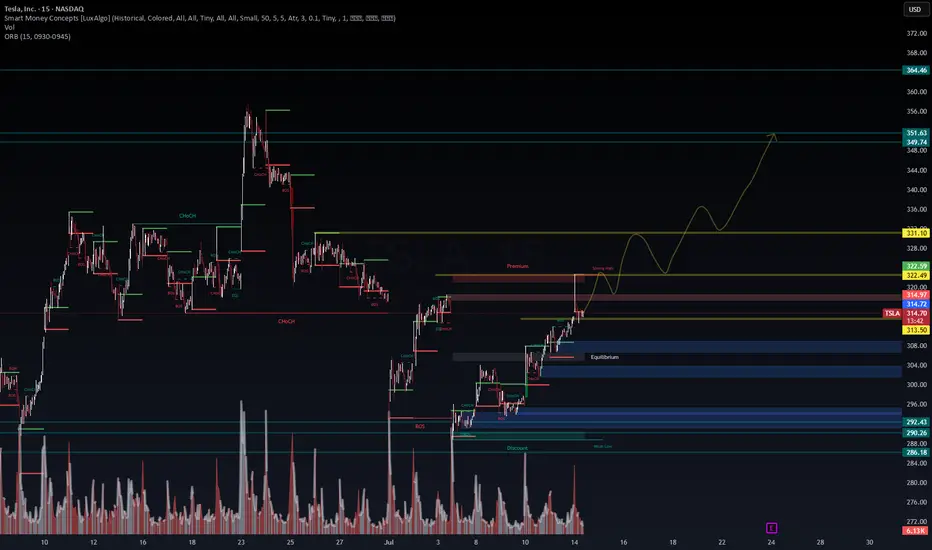
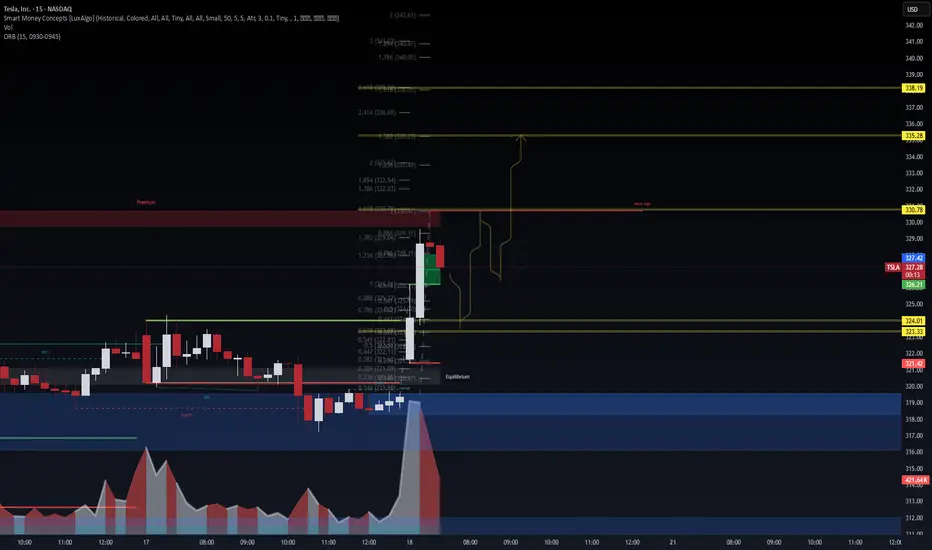
TSLA | Breakout Fuel Loaded – Will the Trend Accelerate Toward 🚗 TSLA | Breakout Fuel Loaded – Will the Trend Accelerate Toward $350?
🔍 Chart Type: 15m
🧠 System: Smart Money Concepts (LuxAlgo) + WaverVanir DSS
📊 Volume: 2.08M
🧭 Narrative: Liquidity Engine + Bullish Flow Momentum
📈 Current Price: $314.78
Clean breakout above BoS and ChgofCHoCH
Currently testing Strong High within a defined Premium Zone
EMA Stack (20/50/100/200) is bullishly aligned
📌 Key Levels to Watch:
📍 Premium Resistance: ~$315–$318
⚖️ Equilibrium Support: ~$309
💧 Discount Liquidity Zones: $292.43, $290.26
🚀 Upside Targets:
Minor: $322.49
Mid: $331.10
Major: $349.74 → $351.63 (projected wave peak)
📈 Bullish Case (Preferred by DSS Flow Model):
Retest of strong high → rally toward $322 then $331
Momentum and volume support trend acceleration
Break of $331 opens path toward $349.74–$351.63 (final wave)
📉 Bearish Invalidator:
Break below equilibrium ($309) → Discount zone retest
Watch $292–$286 for final liquidity sweep if rejection occurs
📅 Catalyst:
Earnings (📦 E icon marked) + macro tech sentiment could ignite explosive continuation
Market structure favors liquidity vacuum toward premium targets
🧠 VolanX DSS Sentiment: STRONG BULLISH
✅ Structure: Uptrend
✅ Volume: Expanding
✅ Momentum: Aligned
🟡 Risk: Premium rejection short-term possible
🔁 Executed via VolanX AI Scanner + WaverVanir DSS Engine
📊 “The Edge Is a System. The System Is Intelligence.”™
#WaverVanir #TSLA #SmartMoneyConcepts #PriceAction #LiquidityZones #Tesla #TechnicalAnalysis #VolanX #InstitutionalEdge #AITrading #QuantFinance
TSLA: Up for earnings on Wednesdayinitial move is, I think $350.
But can Elon bring in the buyers for earnings?
There's a healthy mix of bearish and bullish sentiment, but at the end of the day, promises hold weight, and do they hold weight?
All the best.
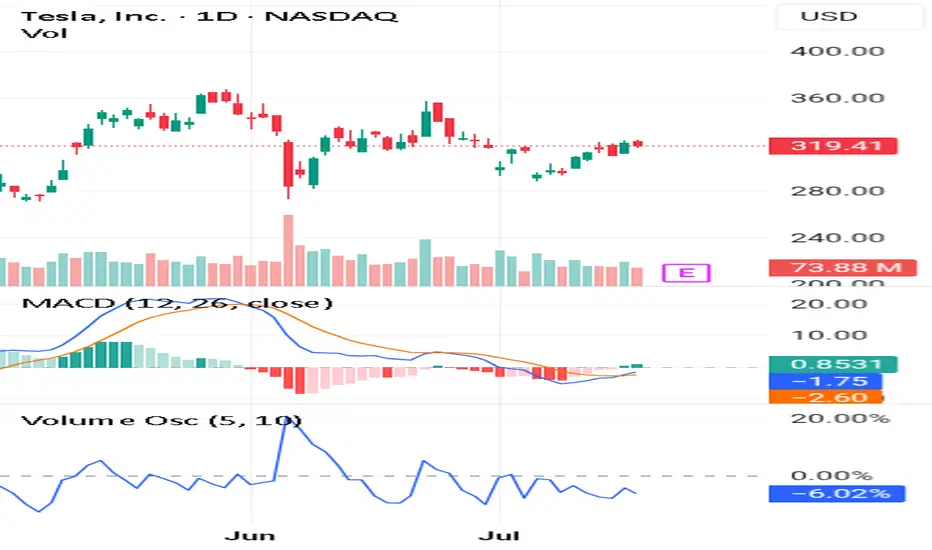
(Learn More)Use These 3 Steps To Spot Long-Lasting Trends👉Trade before the earnings report
👉Make sure the volume oscillator is below zero
👉Make sure the MACD lines give you a Bullish signal
If you look at this chart you can see all the steps alignment.
This is very important because you want to catch a long term trend.
Also it has to follow the 3step rocket booster strategy.
In order for you to learn more about this strategy 🚀 Rocket Boost This Content.
Disclaimer ⚠️ Trading is risky please learn how to use Risk Management And Profit Taking Strategies. Also feel free to use a simulation trading account before you use real money.
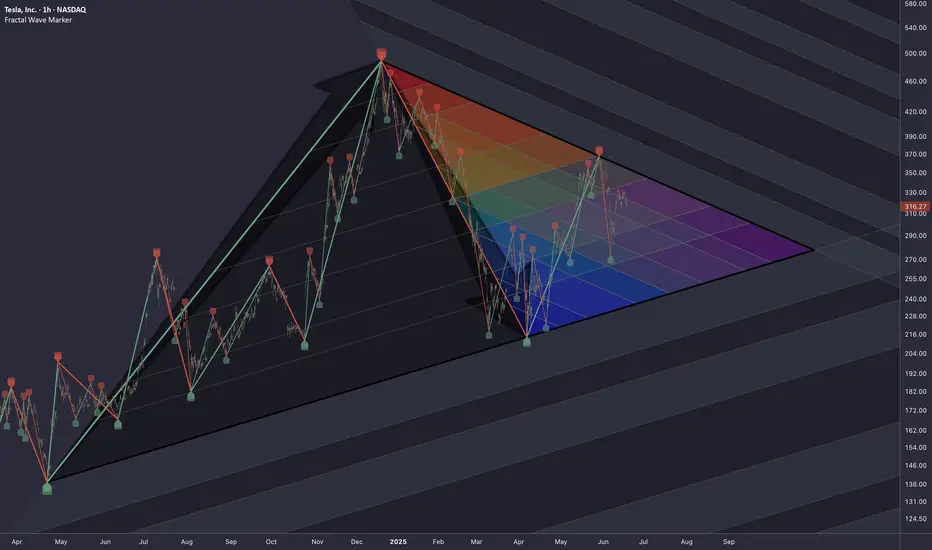
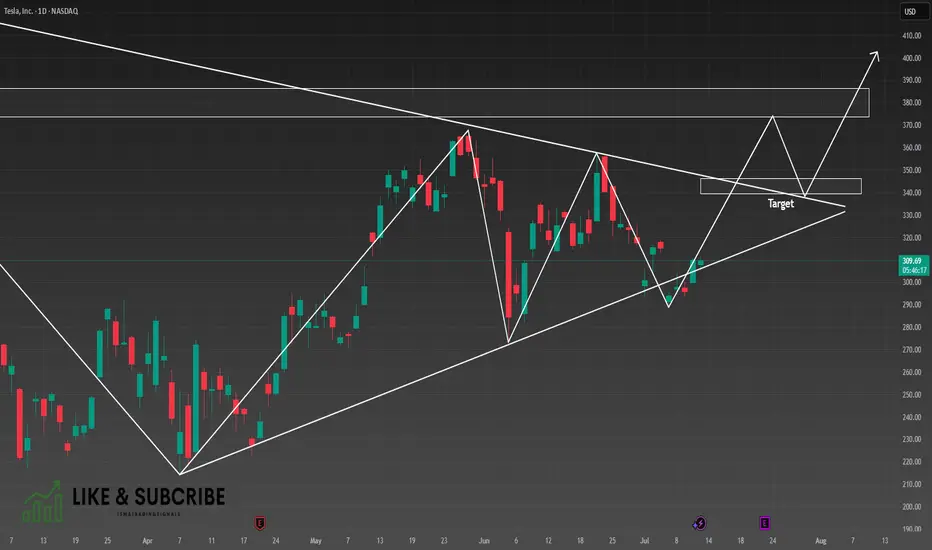
TSLA: Triangle PatternResearching the market through structural lens, particularly the topology of trapped liquidity buildup and compression of volatility, that leads to a proportionally heavier move once a breakout occurs.
Raw compression area derived from waves of higher degrees (2nd, 3rd)
The longer price consolidates within boundaries of a triangular formation, the more significant the breakout tends to be.
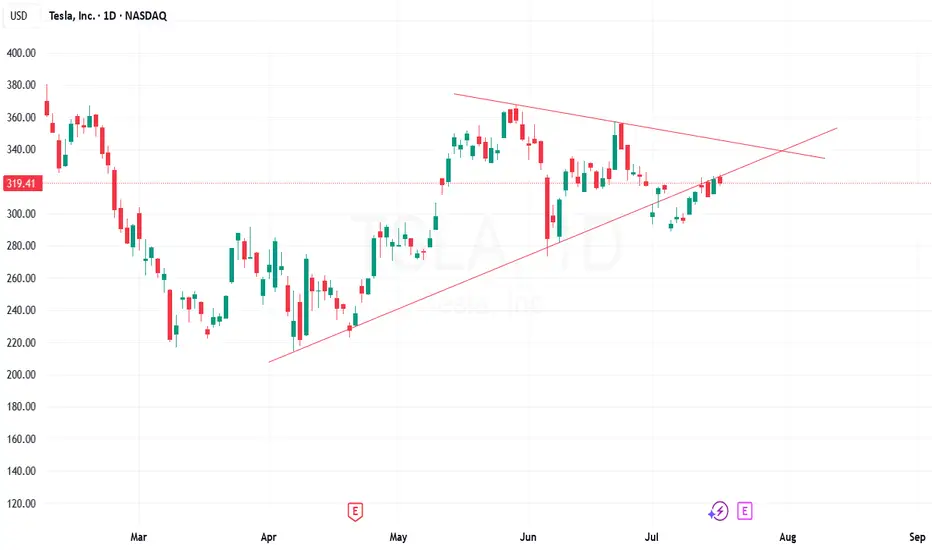
TSLA, Long, 1D✅ TSLA has just broken out of a clear symmetrical triangle pattern, signaling a potential bullish continuation.
Yesterday’s daily candle was a white Marubozu, indicating strong buying pressure and clear dominance by the bulls.
LONG 📈
✅ Like and subscribe to never miss a new technical analysis! ✅
Why TSLA will Crash based On Copper TarrifsHere’s why that bearish outlook is gaining traction:
Copper costs are surging: Tesla uses over 180 pounds of copper per vehicle. With prices spiking 13% in a single day and a 50% tariff looming, production costs are rising fast.
Analysts are cutting price targets: UBS, JPMorgan, and Bank of America have all lowered their forecasts for Tesla, citing margin pressure and weakening demand3.
Brand sentiment is shaky: Tesla’s recent delivery miss and political controversies around Elon Musk have added to investor unease.
Tariff ripple effects: The broader trade war is expected to disrupt supply chains and inflate costs across the EV sector5.
That said, some analysts still see long-term upside if Tesla can pivot quickly—especially with its AI and autonomous driving ambitions. But for now, the market is reacting to the immediate risks.
Overall Enter Short for Gains of 3-5 percent.
Expected to go in Bearish Mode - Keep watchDaily candle clearly says, retracement from the triangle breakout line completed. It showing as reversal.
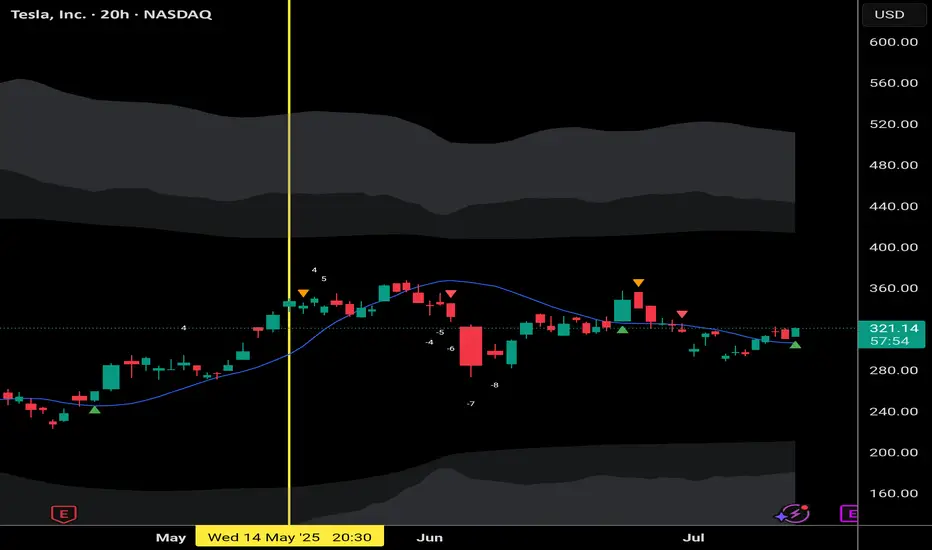
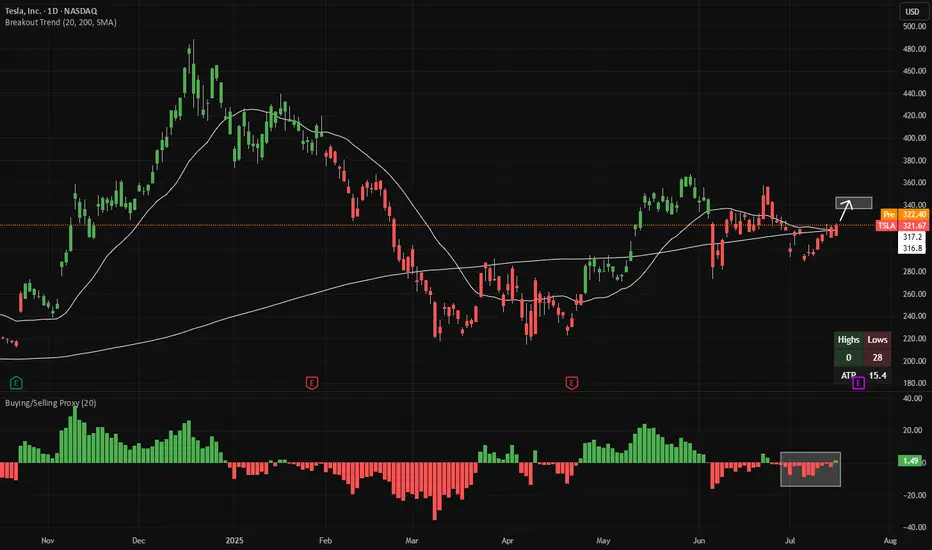
Long TSLA - buyers almost have controlThe buying/selling proxy (bottom panel) is showing signs of net-buying in TSLA. This makes 20-day highs (area indicated in the main chart) more likely to come next. That's around $349.
There is good risk/reward to buy TSLA here, with a stop-loss if the buying/selling proxy flips back to net-selling (red bars). If a 20-day high is made, the candles will change color from red to green.
Both indicators (Breakout Trend and Buying/Selling Proxy) are available for free on TradingView.
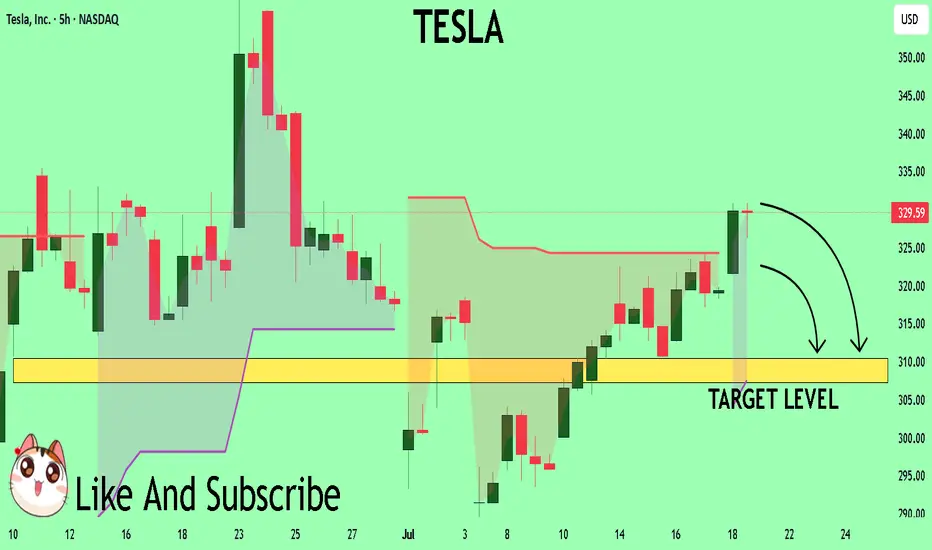
TESLA My Opinion! SELL!
My dear subscribers,
My technical analysis for TESLA is below:
The price is coiling around a solid key level -329.59
Bias - Bearish
Technical Indicators: Pivot Points High anticipates a potential price reversal.
Super trend shows a clear sell, giving a perfect indicators' convergence.
Goal - 310.44
About Used Indicators:
By the very nature of the supertrend indicator, it offers firm support and resistance levels for traders to enter and exit trades. Additionally, it also provides signals for setting stop losses
Disclosure: I am part of Trade Nation's Influencer program and receive a monthly fee for using their TradingView charts in my analysis.
———————————
WISH YOU ALL LUCK
TSLA: Anyone knows this pattern?TSLA:
Anyone knows this pattern?
Think contrarily to the market — seek opportunities in things that few people notice or pay attention to, and when you do, opportunities will come to you earlier than they do to the crowd.
.
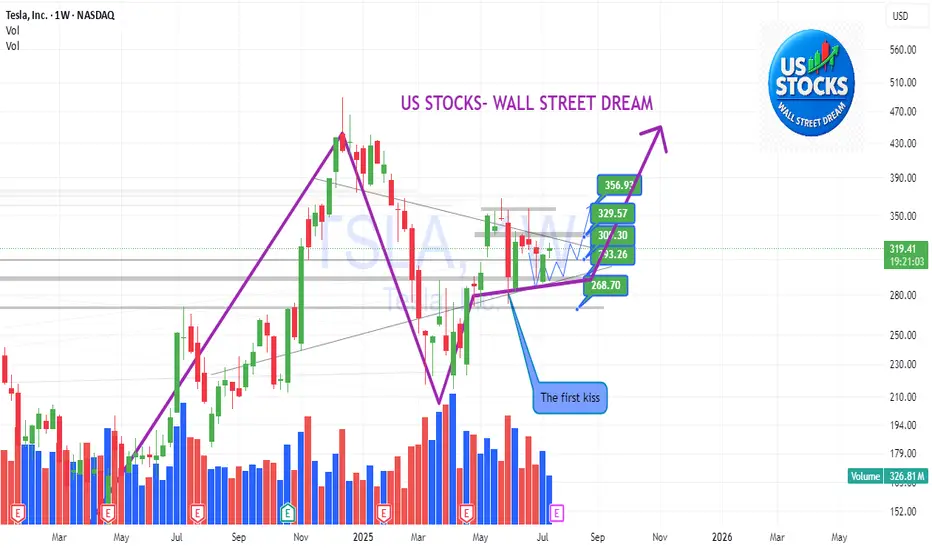
US STOCKS- WALL STREET DREAM- LET'S THE MARKET SPEAK!
Tesla earnings setup favours upsideTesla is scheduled to report its second-quarter results on Wednesday 23 July, after the New York close of trading. The company is forecast to report revenue of $22.8bn, representing a 10.5% year-on-year decline, with earnings expected to decrease 19% to $0.34 per share. Gross profit margins are also anticipated to contract by 2.3 percentage points to 16.4%, down from 18.7% last year.
Tesla does not provide traditional guidance but instead offers a business outlook. In its first-quarter release, the company noted difficulties in assessing the impact of shifting global trade policies and stated it would revisit its 2025 guidance during the second-quarter update. Consequently, investors will undoubtedly be focused on any insights regarding 2025 delivery forecasts, especially given the weak performance in the first half of 2025.
Given the current uncertainty, the market is pricing in a 7.5% rise or fall in the shares following the earnings release. Options positioning is relatively neutral, with only a slight bullish bias. However, there is significant support for the stock between $280 and $300, marked by substantial put gamma levels. Conversely, resistance from call gamma exists between $325 and $330. This setup suggests that it could be easier for the stock to rise rather than fall following the results.
The technical chart clearly illustrates this scenario, highlighting strong support around $290 that dates back to March. More recently, the shares have encountered resistance around the $330 mark. If Tesla can successfully break above this resistance, the stock could move towards approximately $360, while downside seems limited to around $290 to $300.
Written by Michael J. Kramer, founder of Mott Capital Management.
Disclaimer: CMC Markets is an execution-only service provider. The material (whether or not it states any opinions) is for general information purposes only and does not take into account your personal circumstances or objectives. Nothing in this material is (or should be considered to be) financial, investment or other advice on which reliance should be placed.
No opinion given in the material constitutes a recommendation by CMC Markets or the author that any particular investment, security, transaction, or investment strategy is suitable for any specific person. The material has not been prepared in accordance with legal requirements designed to promote the independence of investment research. Although we are not specifically prevented from dealing before providing this material, we do not seek to take advantage of the material prior to its dissemination.
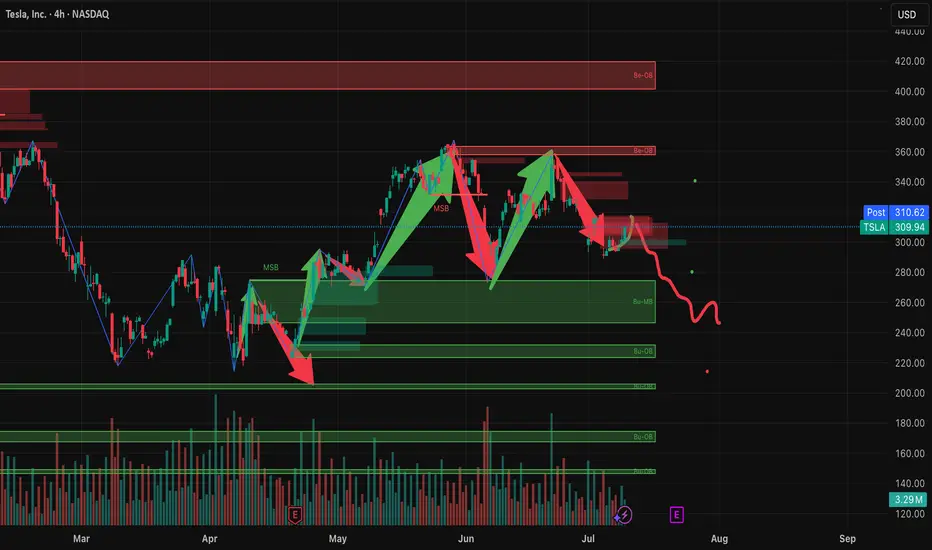
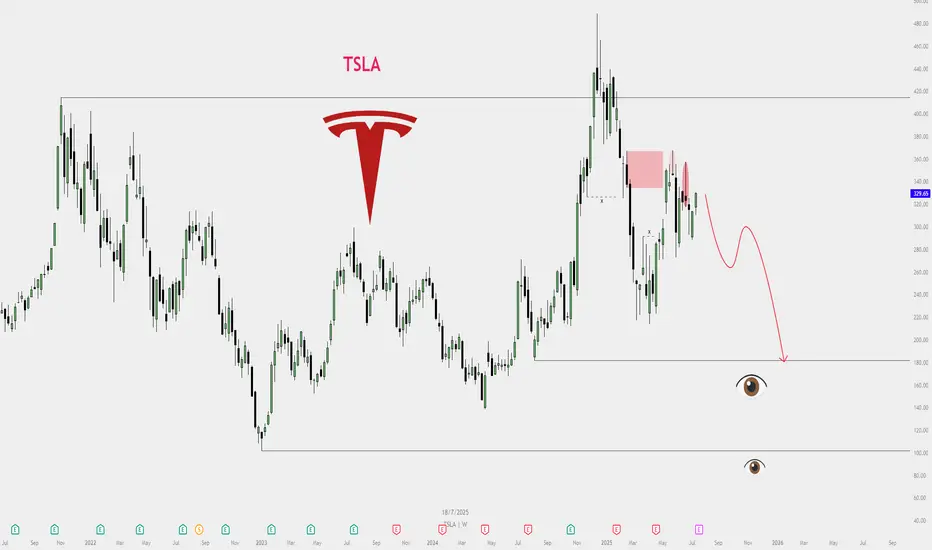
TESLA SELL PLAN – BEWARE BUYERS, FUEL IS BELOW📉 TESLA SELL PLAN – BEWARE BUYERS, FUEL IS BELOW
🔻 Market Structure:
Recent bullish push retraced into a bearish fair value gap (FVG), indicating potential exhaustion in buying.
🟥 Supply Zone Hit:
Price revisited the FVG zone and faced rejection twice, showing sellers are active at that level.
👁️ Liquidity Eyes:
Two major liquidity pools are clearly marked below – price may seek these resting liquidity areas.
🔻 Bias:
Bearish, as price reacted from premium FVG and is forming lower highs.
📍 Execution Plan:
Monitor for continuation patterns on lower timeframe within context.
Ideal short entries can be found after confirmation rejections from FVG zone.
Expect internal liquidity sweeps before the major drop.
🎯 Target:
Watch for price to draw down toward the external liquidity zones below, especially near previous macro demand areas.
⚠️ Note for Buyers:
Current retracement is likely corrective. Until price breaks structure and invalidates the bearish FVG, upside is risky.
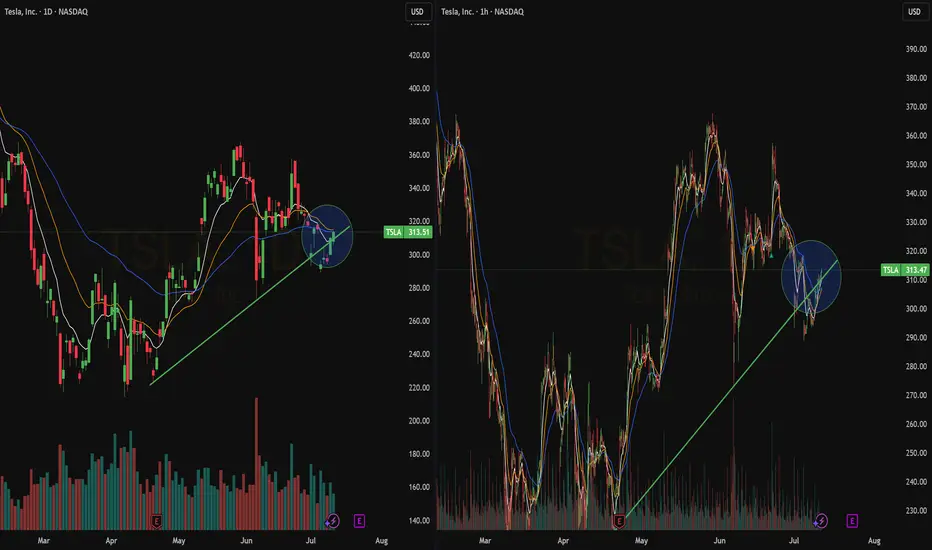
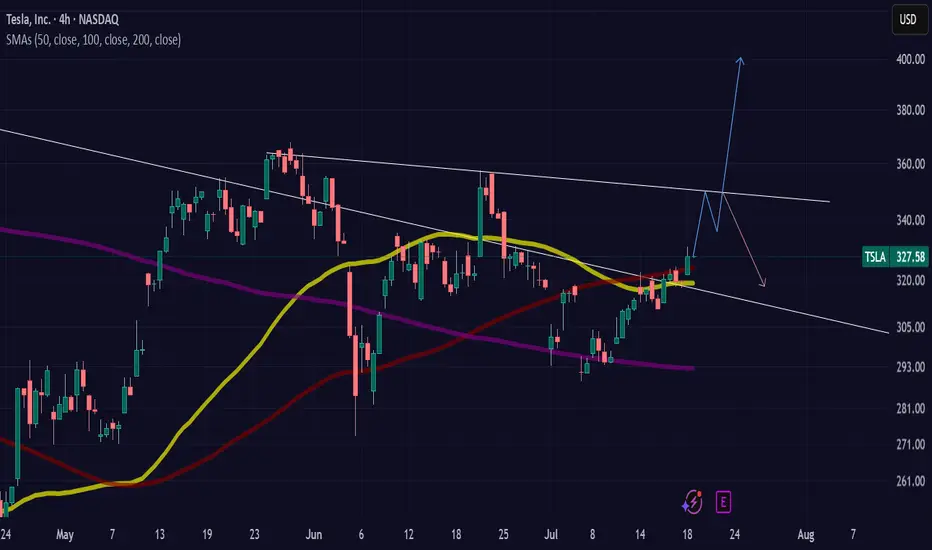
Tesla - Major Breakout BrewingTesla has been going through the wringer, between Robotaxi news, tariffs and the ongoing feud between the most powerful man in the world (Trump) and the richest man in the world (Elon). No doubt the news has had its fair share of impact on the stock. But Technicals will always hold more weight than news. I'll breakdown a few reasons why I believe this stock is due for a major run to ATHs
As you can see on this 4H chart, a nice falling wedge is forming and PA is respecting it, even with the wild gaps. On top of this being a bullish pattern, TSLA is also in a crucial area of support within the $290s . If you look back to Jun 9th 2025, you can see Tesla bounced from the 281 level to the 330s which is another indicator of strong support. Not to mention, a the 50 MA crossed the 200 MA on the daily on July 1st which is another bullish indication. The wedge looks to bottom out at the 280 level but I don't see this stock going that low. $290, 291 is an optimal entry to go long.
The long term trend line from April 21st 2025 has not been completely invalidated as of yet. If it retests at 310 and falls back within the wedge, I am still bullish. If price falls under $280, I am bearish. But until then, load up because the next stop is $350 after breakout, then $400, then ATHs. I'm expecting the breakout to happen by earnings or potentially before if this unnecessary feud between Trump and Elon ends.
P.S. I didn't get a good entry on this trade but I have a long position due to expire on the 25th.
Good luck trading.
-AceBoogieWitMe
How We’ll Trade Earnings This Season Earnings season is almost here — and if you're with QS, you’re already holding the most powerful edge in the market.
Let me walk you through how QS trades earnings, why we built 💸earning-signal, and how you can use it most effectively this quarter.
---
📜 A Little History: The Birth of 💸earning-signal
When QS launched in early April, we started with just two short-term signals:
⏰0dte
📅weekly-options
Both focused on short-term options trades.
Then came TSLA earnings in late April. That’s when we launched our very first 💸earning-signal — and nailed the prediction.
Since then?
We’ve had one of the best earnings win streaks on the internet. Period.
📌 Don’t take my word for it — check:
#✅signal-recap for the track record
#🤑profits and #🤩member-testimonials for real wins from members
---
🤖 Why We Built a Separate Earnings Signal
Earnings are not regular trading days. The dynamics are completely different.
On normal days, a stock might move <1%
On earnings? 10–20% swings are common
This is what we call a “pivot event” — and it requires a different engine to predict.
That’s why we separated:
📅 #weekly-options → normal day-to-day setups
💸 #earning-signal → high-volatility earnings plays
---
🧠 How a Human Would Trade Earnings...
If you wanted to manually trade an earnings report, you’d need to analyze:
Past earnings reactions
Analyst expectations
Earnings call language
Financial statement surprises
Options IV & skew
Post-earnings stock behavior
This would take hours (or days) — and most retail traders don’t have time.
---
⚙️ How QS AI Does It Instead
We built 💸earning-signal to do all that work for you — and more.
✅ It pulls in all the data above
✅ Runs it through 5 top LLM models (each acts as an independent analyst)
✅ Aggregates their insights + calculates probability-weighted direction & strategy
✅ Uses fine-tuning to learn from its past prediction success/failures
This means: faster decisions, deeper insights, and better accuracy — every week.
We don’t just run predictions. We let the AI learn from past mistakes and self-improve each quarter.
---
💥 Results Speak for Themselves
Last season, we nailed:
TSLA
MSFT (10x–20x winners!)
NVDA
AAPL
And many more...
All based on this unique AI-driven earnings analysis stack.
This season?
We’re going harder, faster, and even smarter. 📈
🎯 The goal is clear:
Make 💸earning-signal the #1 earnings prediction system in the world.
---
🧩 Final Notes
Earnings are 10x harder to trade than regular days
But with QS, you’re equipped with 500x the speed and insight of an average trader
Upgrade if you haven’t yet: #💰upgrade-instructions
Earnings season kicks off next week
Let’s get it.
Let’s win big.
Let’s make season 2 of 💸earning-signal our most legendary yet. 🚀💸
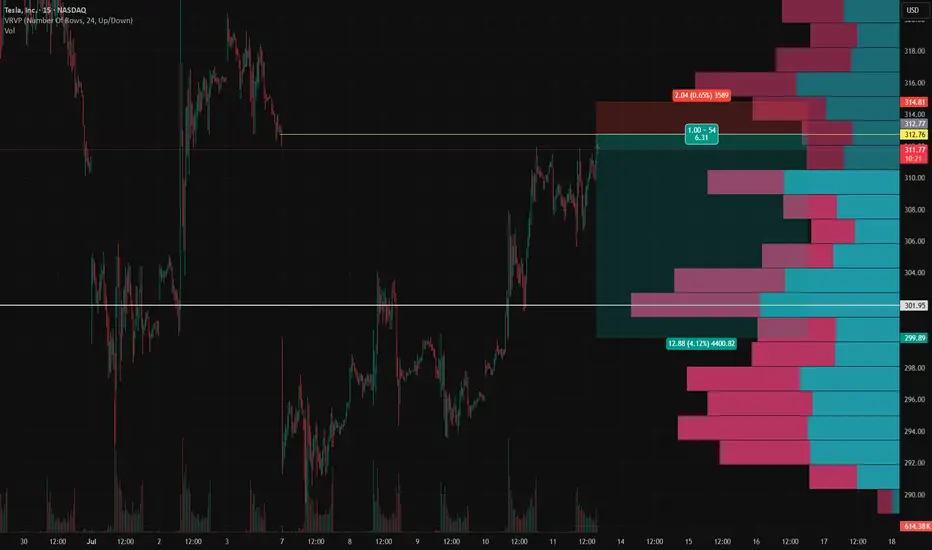
TSLA Short Setup – Fading the July 7 Gap FillTSLA Short Setup – Fading the July 7 Gap Fill 📉
This short idea on TSLA builds off a key gap fill from Monday, July 7 , combined with a strong local volume profile and risk-reward alignment on the 15-minute chart.
Entry: $312.76
Stop Loss: $314.81 (above gap resistance and local high)
Target: $299.89 (gap base and volume shelf)
RR: ~6.3R
Why I'm shorting here:
TSLA has just filled the July 7 gap , which often acts as a technical resistance zone on retest.
Price stalled right as it completed the fill — with visible hesitation and selling pressure stepping in.
VRVP shows low liquidity above, suggesting diminished reward for upside continuation.
Below, there's a clean volume shelf around $294–$300 that could attract price if weakness confirms.
Trade Logic:
This is a classic fade-the-gap-fill setup, targeting the lower edge of the volume cluster for a potential bounce or reversal zone.
As always: size accordingly, stick to the stop, and don’t chase if the entry’s already gone.
Thoughts? Anyone else watching this gap level?
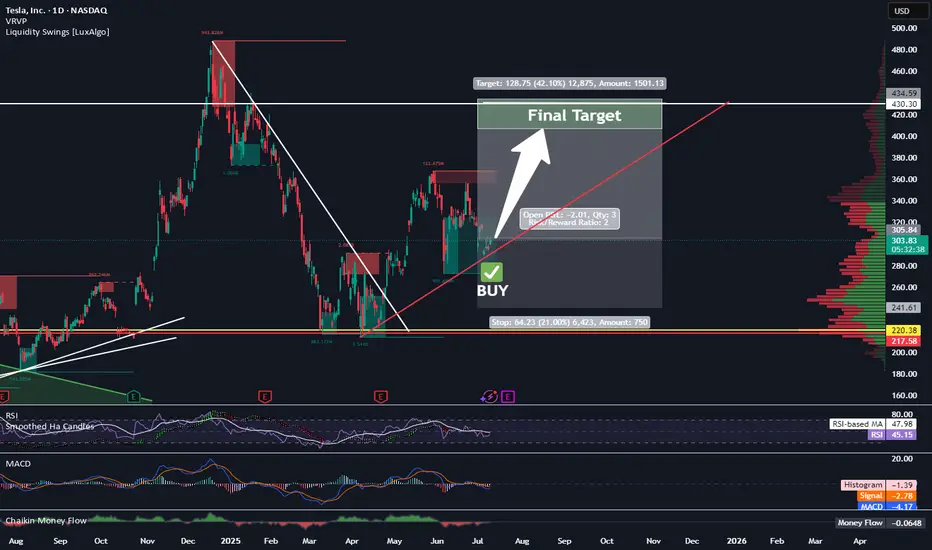
Long TESLATrading Fam,
Today my indicator has signaled a BUY on $TSLA. The technicals align. M pattern looks to have completed at strong support (RED TL) and is bouncing upwards inside of a solid liquidity block. Buyers are stepping in. I'm in at $315 and will shoot for $430 (probably taking some profit along the way). My SL is currently $241 but will trail as we enter profit.
Best,
Stew
Tesla (TSLA) Market UpdateTesla NASDAQ:TSLA shares dropped nearly 7% after Elon Musk dismissed analyst Dan Ives' suggestion to scale back his political activities. Musk also proposed a new pay package, raising concerns among investors about potential distractions from Tesla’s core business.
📊 Upcoming Catalyst:
Tesla is set to report its Q2 earnings on July 23, with investors eagerly awaiting updates on the company’s financial performance and the newly launched robo-taxi service in Austin, Texas.
⚠️ Sentiment:
Recent bearish headlines include:
Concerns over potential Robotaxi issues
The ongoing Trump/Elon Musk political drama
📈 Trading Opportunity (Long Setup):
Despite the negative sentiment, this dip could offer a solid long entry opportunity:
Entry Zone: $275–$270
Take Profit Targets:
TP1: $315
TP2: $335
Stop Loss: Close below $265
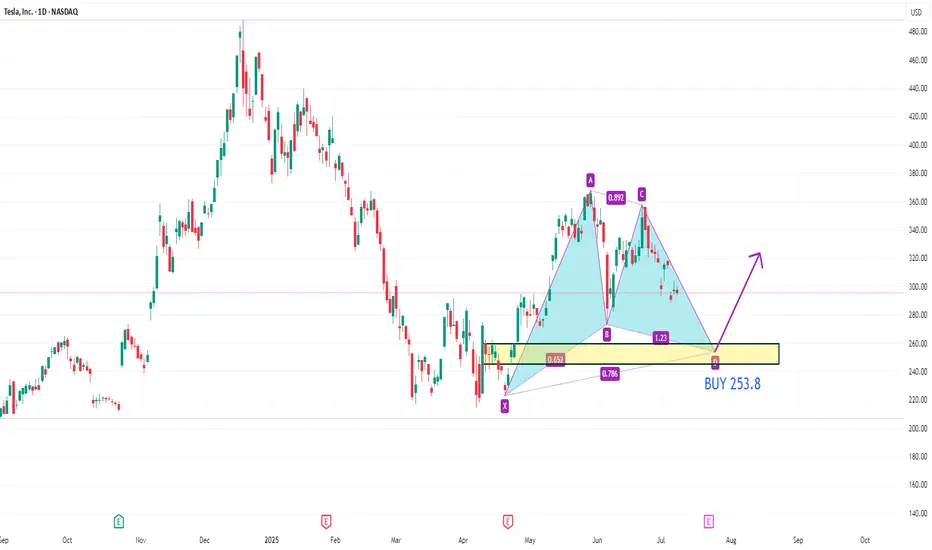
TSLA BUY 253.8Recently, TSLA has maintained a volatile operation. Currently, we can pay attention to the area around 253.8 below, which is a potential buying position for a bullish Gartley pattern. At the same time, this position is within the previous demand area.
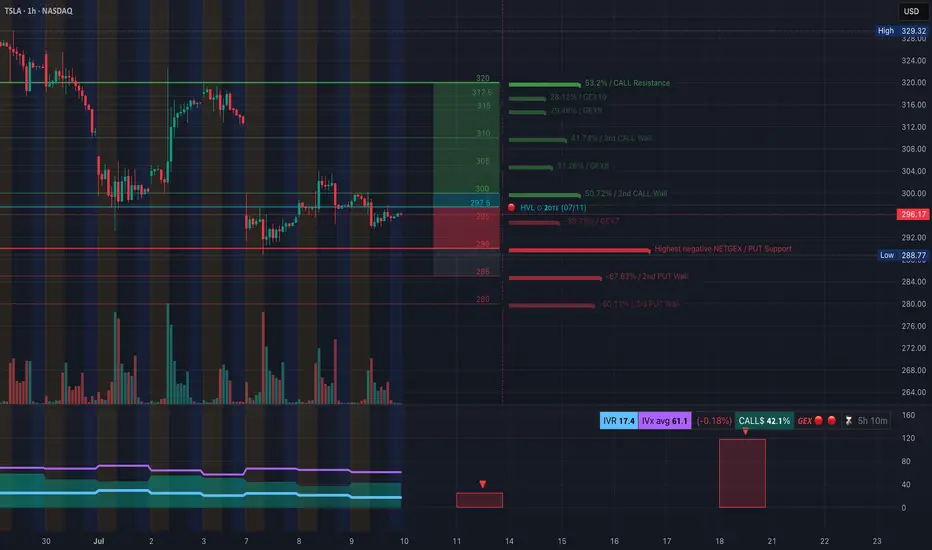
TSLA Caught in Tug-of-War-TA for July 10TSLA Caught in Tug-of-War: Key Gamma & Price Action Setups Unfolding ⚠️
🔍 GEX (Gamma Exposure) Analysis:
Tesla’s options market is highly polarized heading into the week.
* Gamma Walls: Strong Call Wall near $304–$310, showing potential upside magnet if bulls regain control. Above this, the $317.5–$320 zone could trigger a gamma squeeze.
* Put Walls: The $288–$285 zone represents a heavily defended downside, marked by high negative NET GEX and multiple put walls.
* Current GEX Bias: Negative gamma regime persists, increasing potential for volatile moves and sharp directionality.
* IVX is elevated at 61.1, with IVR 17.4, suggesting the options market is pricing in moderate near-term volatility.
📈 Options Trade Ideas:
* Bullish Setup: Consider July 12/July 19 300c–310c debit spread if price confirms reclaim of $300, targeting a gamma squeeze toward $317.5–$320.
* Bearish Setup: If price breaks below $288, buy 285p–275p vertical or 295p straight puts, expecting continuation toward $280 and below.
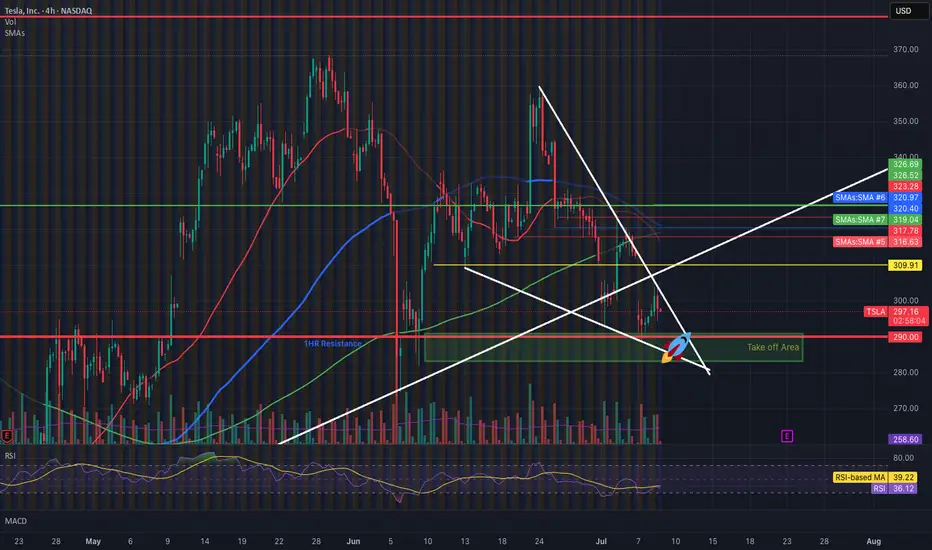
🕒 1H Price Action Outlook:
Tesla remains stuck in a tight consolidation wedge, showing a battle between supply at $300–304 and demand near $288–290.
* Structure: Market formed a bullish BOS earlier this week but failed to extend higher. The latest CHoCH + rejection from $300 zone suggests sellers are still active.
* Range: Coiling inside a triangle formation with tightening price action. A breakout or breakdown is imminent.
* Demand Zone: The green liquidity block around $284–$288 has held firm so far.
* Trendlines: Price is being compressed between a descending trendline (supply) and ascending trendline (demand), signaling a make-or-break moment.
🎯 Intraday Trade Plan:
* Bullish Case:
* Entry: Above $300 with volume
* Target: $304 → $310 → $317
* Stop: Below $294
* Bearish Case:
* Entry: Breakdown below $288
* Target: $284 → $280
* Stop: Above $295
💭 Final Thoughts:
TSLA is in a pressure cooker. A breakout above $300 opens the door to gamma-driven upside, but continued compression or a loss of $288 support could trigger a fast liquidation. Monitor volume closely — this wedge is near resolution.
This analysis is for educational purposes only and does not constitute financial advice. Always do your own research and manage risk responsibly.