Long-Term Growth Potential in the Face of Short-Term ChallengesCurrent Price: $323.63
Direction: LONG
Targets:
- T1 = $331.50
- T2 = $345.00
Stop Levels:
- S1 = $319.50
- S2 = $310.00
**Wisdom of Professional Traders:**
This analysis synthesizes insights from thousands of professional traders and market experts, leveraging collective intelligence to pinpoint high-probability trade setups. The wisdom of crowds principle suggests that aggregated perspectives from experienced professionals build a more balanced outlook on Tesla, reducing emotional biases and highlighting consensus opportunities in the market.
**Key Insights:**
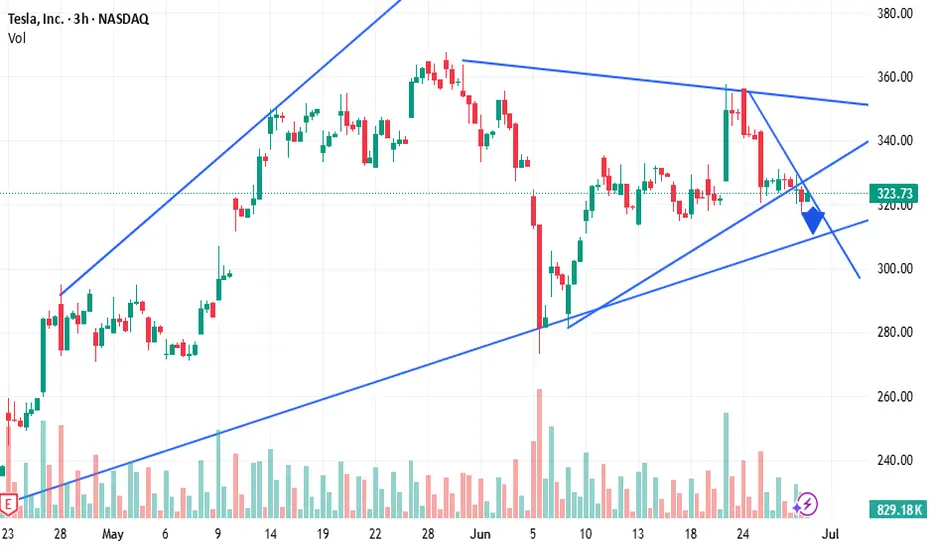
Tesla is currently navigating through a challenging phase characterized by competitive pressures in both China and Europe. Recent macroeconomic headwinds, including rising interest rates and shrinking global spending on electric vehicles, have fueled concerns about short-term sales performance. However, analysts remain optimistic about Tesla's innovation leadership, particularly in AI-driven robotics, battery technology, and autonomous mobility development. The recent technical charts reflect a narrowing wedge formation, and a breakout above $354.78 could confirm renewed bullish momentum, offering significant upside potential.
**Recent Performance:**
Over the past few weeks, Tesla has experienced tight price consolidation, underlying near-term indecision among market participants. While its stock price remains below short-term moving averages, signaling bearish pressure, longer-term sentiment is bolstered by overall optimism in the technology sector. Additionally, fluctuations in deliveries and revenue from various regions continue to impact day-to-day trading sentiment, with the stock showcasing higher volatility during earnings updates.
**Expert Analysis:**
Market analysts exhibit cautious optimism surrounding Tesla. Short-term concerns linger about declining sales growth in legacy markets such as Europe and the loss of its dominant position in China due to rising competition from local manufacturers like BYD. However, whether Tesla can monetize its cutting-edge developments in AI, robotics, and autonomous driving remains a focal point of its long-term strategy. Analysts agree that while these initiatives may redefine the EV market over the next 5-10 years, revenue realization is expected to be slow and could dampen speculative enthusiasm in the immediate term.
**News Impact:**
Tesla recently announced the launch of its robo-taxi initiative, beginning trials in Austin, Texas, a move that challenges traditional mobility norms. While this innovation enhances Tesla's narrative as a disruptor in the industry, regulatory obstacles and scalability issues pose immediate hurdles that could delay market adoption. On the downside, Tesla saw declining deliveries in Europe and China, casting shadows over its near-term growth prospects in these critical regions. Investors should keep a close eye on upcoming earnings reports for clearer guidance on production schedules and delivery forecasts.
**Trading Recommendation:**
Based on recent technical consolidation and consensus expert views, traders are recommended to take a long position on Tesla with price targets of $331.50 and $345.00. The stock exhibits signs of medium-term upside potential if momentum aligns with broader bullish trends in the S&P 500 and technology sectors. Implement disciplined risk management with stop levels set at $319.50 and $310.00 to protect against unfavorable moves. Investing in Tesla provides exposure to a high-risk innovation-driven narrative; traders should evaluate their appetite for risk carefully before entering this position.
TSLAC trade ideas

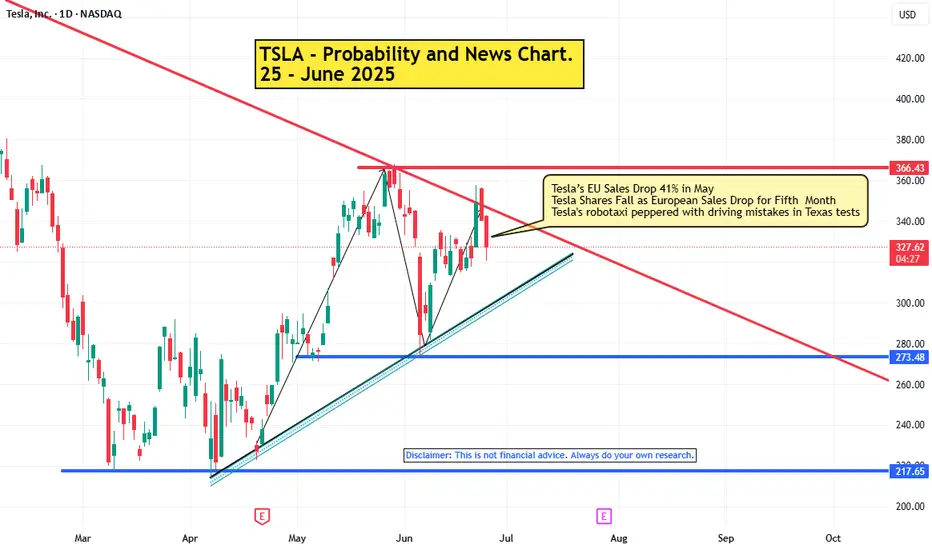
TLSA Catalyst Ranking and Market Update: June 2025Here's an updated/revised outlook for TSLA including all the primary
catalyst ranking and analyst ratings and overview of latest developments
🔋 1. EV Demand Growth
Strength: 9/10 → 9/10
Global electric vehicle adoption remains the dominant pillar. Tesla faces softer comp in Europe (–40.5% drop in May) wsj.com, but overall trend remains firmly upward. 🌍
🚗 2. Affordable Entry Level Model
Strength: 8.5/10 → 8.5/10
Tesla still on track to launch a < $25K EV in first half of 2025. Any delays or execution issues could pressure sentiment.
⚡ 3. Battery Cost & Margin Improvement
Strength: 8/10 → 8/10
Margins saw slight relief Q1, driven by cost cuts f, but macro headwinds persist.
🤖 4. Autonomy & Robotaxi Rollout
Strength: 7.5/10 → 8.5/10
Robotaxi debuted in Austin in June, sparking a ~10% one-day stock surge. Benchmark raised its target to $475/buy on the rollout—strong tailwind.
🚩 5. Competition
Strength: 7/10 → 6.5/10
Rivals like Xiaomi’s new YU7 are gaining ground. Tesla must maintain differentiation.
📉 6. Trade Policies & Tariffs
Strength: 6.5/10 → 6.5/10
Still relevant due to Tesla’s global footprint, though less front-page than before.
💰 7. Incentives & Subsidies
Strength: 6/10 → 6/10
U.S. IRA tax credit policies remain supportive; evolving eligibility remains a swing factor.
🛢️ 8. Commodity Costs
Strength: 5.5/10 → 5.5/10
Raw-material swings affect margins. Inventory hedges help but not wholly mitigate.
📈 9. Fed & Interest Rates
Strength: 5/10 → 5/10
A higher-rate environment still limits valuation multiples for growth-tier companies.
🎭 10. Musk Profile & Governance
Strength: 4/10 → 5/10
Analysts (e.g., Bradley Tusk) warn of being “massively overvalued” tied to Musk’s persona. Musk’s renewed focus on Tesla vs. other ventures (DOGE, SpaceX) will be watched.
________________________________________
🚀 Refreshed Catalyst Rankings
Rank Driver Score
1 EV demand growth 9
2 Affordable model 8.5
3 Battery costs/margins 8
4 Autonomy/robotaxi execution 8.5
5 Competition 6.5
6 Trade & tariffs 6.5
7 Regulatory incentives 6
8 Commodities 5.5
9 Fed Rates 5
10 Musk reputation/governance 5
________________________________________
📊 Latest Analyst Ratings & Targets
• Benchmark / Mickey Legg: Buy, target $475 (from $350) — cites robotaxi safety-first rollout, automation upside
• Wedbush / Dan Ives: Outperform, target $500 — labels TSLA as an “embodied AI compounder”
• Morgan Stanley / Adam Jonas: Buy, target $410 — bullish on AI/self driving positioning
• Cantor Fitzgerald / Andres Sheppard: Overweight, target $355 — optimism rooted in robotaxi and FSD rollout
• UBS / multiple: Sell, target $215–225 — skeptical on demand and valuations
Consensus snapshot (FactSet):
• Mean price target ≈ $311–$312
• Mean rating between Hold–Buy (~2.7/5)
________________________________________
🗞️ Recent Headlines
• “Tesla completes first fully autonomous Model Y delivery ahead of schedule”
• “Tesla robotaxis launch in Austin” boosting momentum
• “EU Tesla sales slump” May registrations down 40.5%
• “Tesla fires longtime insider as Europe slump deepens”
________________________________________
🔍 Summary Outlook
Tesla shares are navigating a volatile interplay of strong tech promise and unfolding execution risks:
• Overweight view (Legg, Ives): Robotaxi rollout and AI thrust fuel upside. Automation transition seen as transformative.
• Bullish base (Jonas, Sheppard): AI, FSD rollout, affordable model support core thesis.
• Skeptical view (UBS, Tusk): Slumping deliveries in Europe/China, heavy valuation, Musk's external focus seen as emotional dampener.
Upcoming triggers to watch:
1. Q2 delivery and production results (mid July).
2. Robotaxi rollout execution/regulatory clearance.
3. Margin trajectory as costs evolve.
4. FSD reliability and expansion in new markets.
________________________________________
✅ What This Means for You
• Bull case: Robotaxi + AI momentum may drive TSLA back toward targets in the $475–500 range.
• Bear case: Weak deliveries, macro and competition pressures could cap shares or trigger pullback toward prior support ($330–350).
• Neutral: Watch near-term delivery and autonomy news to shape next move.

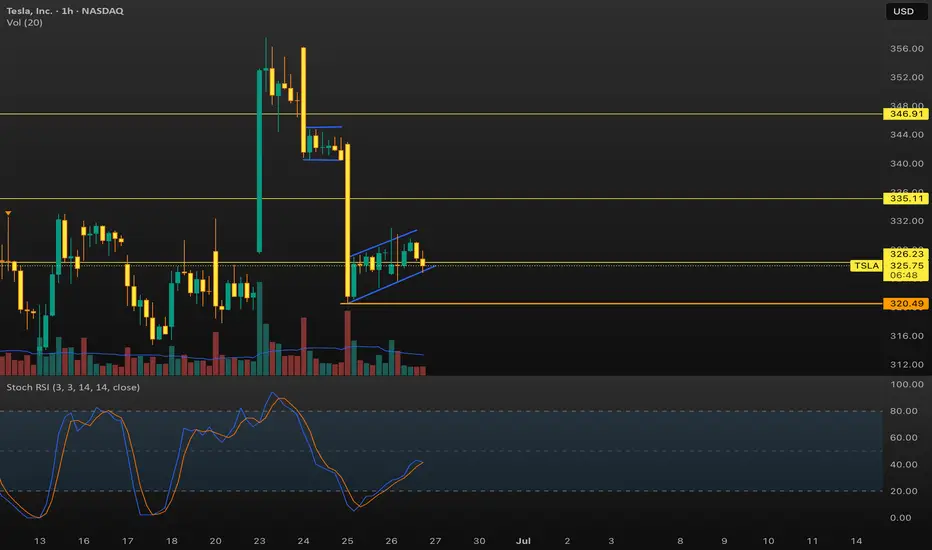
TSLA Bearish Breakdown in Progress – $322 or Bust? TSLA Bearish Breakdown in Progress – $322 or Bust? Monday Puts On Watch 🔻
🧠 GEX-Based Options Sentiment:
Tesla is currently trading right at a critical GEX flip zone. The $330 level used to be gamma support but has now broken, leaving TSLA vulnerable to a drop toward the high-risk gamma pocket between $320–$310.
The Highest positive GEX zone was stacked near $330–$340, but that structure has failed. The gamma walls above—like $347.5 and $350—now serve as resistance, especially with no strong call flow to support a squeeze.
The downside gamma structure is open. $310 is a soft magnet, but $300 is where the largest negative GEX sits, along with the 2nd and 3rd Put Walls. If TSLA continues slipping, a drop into the $300 zone could be swift.
Implied Volatility Rank is at 25.2, with IVX above 68 — meaning options are expensive, so spreads are safer than naked calls or puts. Flow is still 8% call-heavy, but that can flip hard if Monday starts red.
🔧 Options Trade Setup (for Monday–Wednesday):
Bearish Scenario (favored setup):
If TSLA opens weak or rejects $325–$327.50 area again, consider buying a PUT debit spread, such as 322p/310p or 320p/300p (July 3 expiry).
Target zone: $312, then $300 gamma flush.
Stop: reclaim of $331 with bullish momentum.
Bullish Scenario (lower probability):
If TSLA reclaims $330 and breaks trendline toward $335, consider a CALL debit spread like 335c/345c (Jul 3).
Target zone: $345–$350.
Cut if it falls back under $327.50.
📉 Intraday Technical Breakdown (1H Chart):
The price has confirmed a CHoCH + BOS combo, rejecting from supply and pushing below the rising trendline. Friday’s recovery attempt stalled right under that broken structure, and sellers took over late day.
The 1H chart is forming a bearish descending channel, with price currently trying to bounce off short-term demand, but failing to reclaim the key mid-zone.
This current setup favors continuation lower unless bulls can pull off a breakout early Monday. Otherwise, the path of least resistance is down.
📌 Key Levels to Watch:
$330.00 – Former GEX support, now resistance
$331.10 – Trendline and bearish trigger flip
$322.00 – Key support line (last defended Friday)
$320.00 – Gamma pivot zone
$310.00 – GEX magnet and low-volume shelf
$300.00 – Highest negative GEX and major PUT support zone
$345.25 – Upper trendline + prior supply rejection
✅ Thoughts and Monday Game Plan:
TSLA is sitting on the edge of a breakdown. The gamma structure supports further downside as long as price stays below $330. Watch for early rejection at $325–$327.50 to initiate puts.
If bulls manage to gap and reclaim above $331, reassess for a reversal setup — but for now, structure, volume, and GEX are all pointing down.
This is a reactive trade — wait for early confirmation on Monday and ride the wave, especially if SPY opens weak.
Disclaimer:
This analysis is for educational purposes only and not financial advice. Always trade with proper risk management and do your own due diligence.

TESLA CORRECTION ON THE WAY? + MY WATCHLIST FOR JULY 2025In this video, I run through a couple stocks that look very interesting going into Q3 2025, all stocks listed below!
NASDAQ:TSLA
NASDAQ:CELH
NYSE:EL
NYSE:NKE
NASDAQ:SOFI
AMEX:SPY
NASDAQ:QQQ
NASDAQ:AMD
NASDAQ:CAKE

super sell on the run for TSLAwe looking for sells on this pair as you can see there is a trend moving up but there is likly to have a short sells going on now
"Tesla: Accumulating Before Takeoff?"Tesla's acting weird, but to me, it looks like it's just loading up. Every time it hits that $320 zone, it bounces back hard. That’s not random — there’s volume, and it’s holding that level with respect.
If it breaks above $330 with solid volume, this thing could easily hit $356 or more. And with earnings coming up and all that robotaxi noise Elon keeps teasing… wouldn’t be surprised if it pops hard.
I’m not saying buy right now, but I’ve got my eyes on it. If I see confirmation, I’m jumping in with a long contract. Now, if it drops below $312 with conviction, I’m out — no hard feelings.
This could get real interesting. Stay sharp.
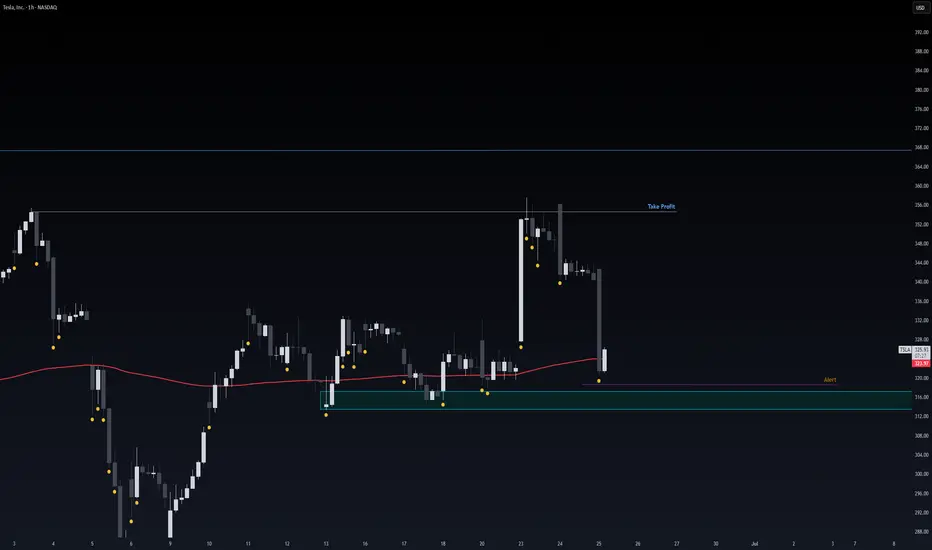
Safe Entry Zone TeslaGreen Zone is Safe Entry Zone.
Target is Take Profit line.
Note: 1- Potentional of Strong Buying Zone:
We have two scenarios must happen at The Mentioned Zone:
Scenarios One: strong buying volume with reversal Candle.
Scenarios Two: Fake Break-Out of The Buying Zone.
Both indicate buyers stepping in strongly. NEVER Join in unless one showed up.
2- How to Buy Stock:
On 15M TF when Marubozu Candle show up which indicate strong buyers stepping-in.
Buy on 0.5 Fibo Level of the Marubozu Candle, because price will always and always re-test the imbalance.
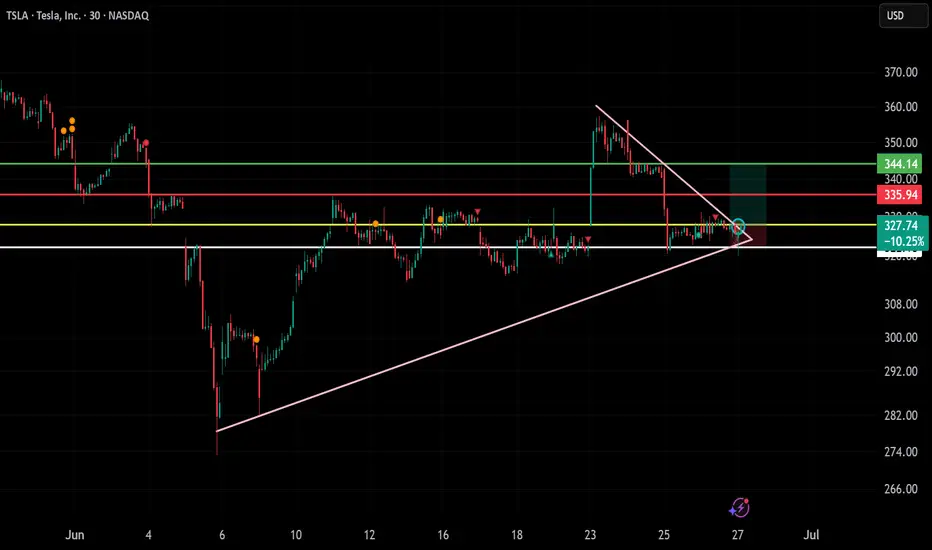
TSLA Long Trade Setup !📈 🚀
Price squeezing at triangle apex—breakout zone 📊
Entry: $327.38 ✅ | Stop: $322.18 🛑
Target: $344.14 🎯 — bullish pressure building! 🔼
#TSLA #LongTrade #TeslaStock #BreakoutSetup #TradingView #TechnicalAnalysis
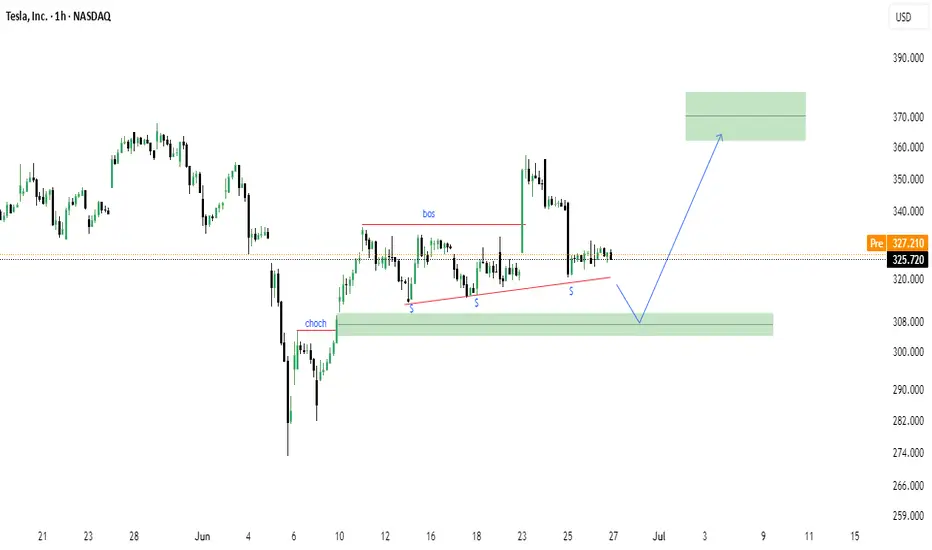
Tesla (TSLA) -Bullish Reaccumulation Setup | Smart Money conceptTesla shows a clean CHoCH followed by BOS structure, indicating a potential bullish continuation. The market is forming equal lows into a demand zone (green box), suggesting a possible liquidity sweep before a move higher.
Key Technical Points:
CHoCH (Change of Character) confirmed on strong bullish impulse.
BOS (Break of Structure) signals market intent to continue upward.
Ascending triangle structure with multiple support tests (marked "S").
Anticipated sweep into demand zone: $308–$312 area.
Potential upside target: $365–$375 supply zone.
Bias: Bullish on confirmation of demand reaction.
Disclaimer:
This is not financial advice. Always do your own analysis before investing.
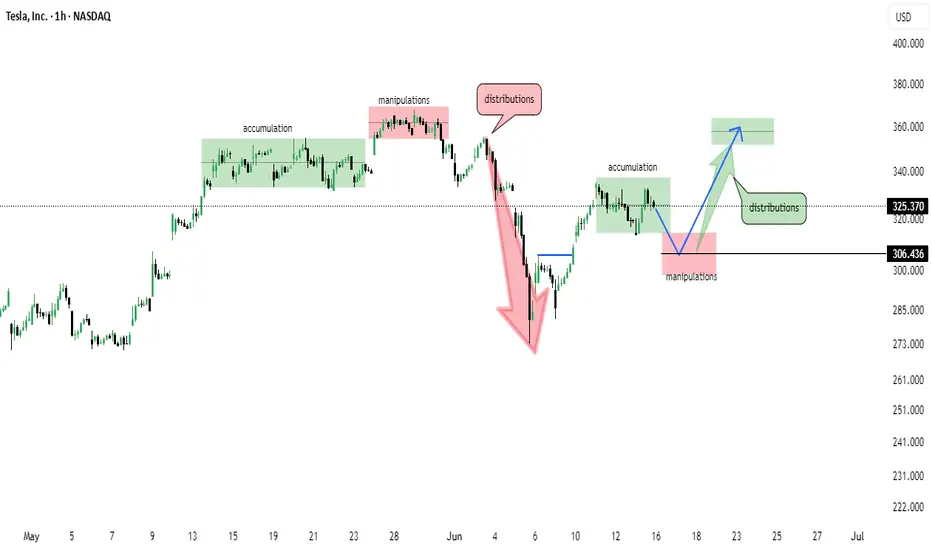
Tesla (TSLA) 1H Chart – Wyckoff Cycle in ActionThis chart reflects a textbook Wyckoff pattern unfolding on TSLA’s 1-hour timeframe:
🔹 Accumulation Phase observed early May
🔹 Followed by Manipulation & Distribution – classic trap before markdown
🔹 Sharp selloff led to another Accumulation zone around $305
🔹 Further manipulation wicks indicate smart money involvement
🔹 Now projecting a move towards $360–$370 distribution zone
📌 Structure breakdown:
Smart Money Accumulation ➡️ Manipulation ➡️ Distribution
Bullish momentum building from $306 support
Eyes on reaction near the marked green distribution box 📦
📅 As of June 15, 2025 – chart aligns with Wyckoff theory and institutional behavior.
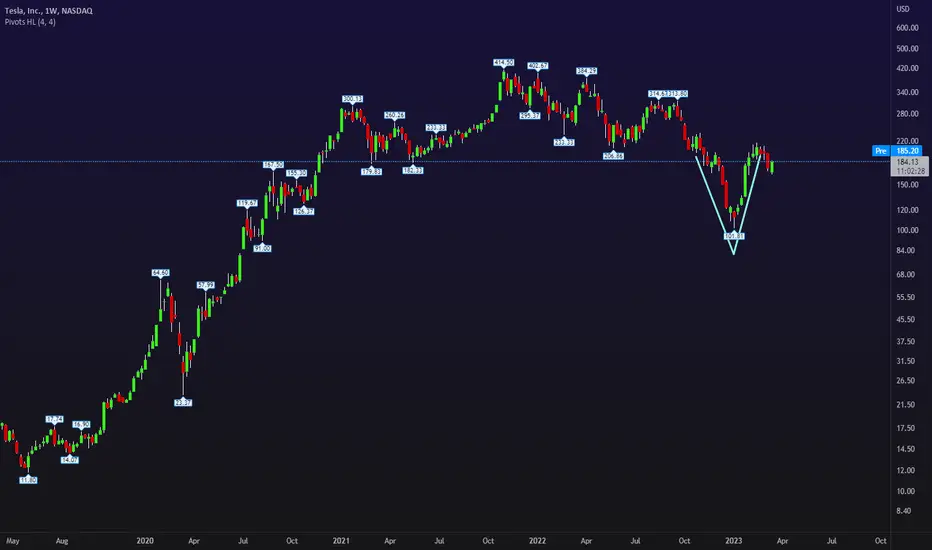
V-Bottom + Apocalypse news => Going UpV bottom was formed.
News are clearly bearish in a conclusive way =>> fool the public to sell shares to the big fish while the market will go up...
Overall market sentiment under the hood is bullish. Public is in huge fear of banks that collapsed and will continue to collapse, so the masses will sell stocks on an up wave fearing it will go down.
How else you will make the mass public sell their stocks? if there is no apocalypse on the way...? think about it...
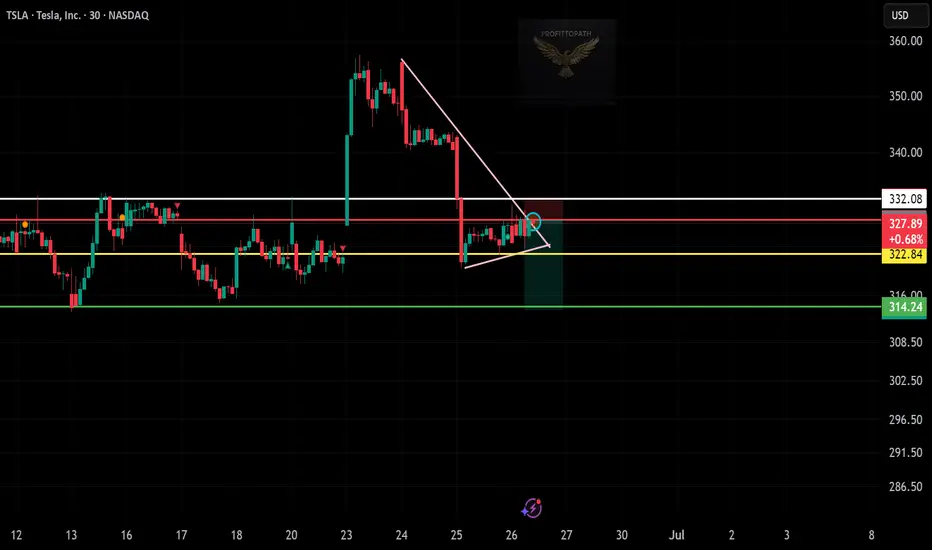
TSLA Short Setup Alert!Price rejected near resistance and forming lower highs.
Entry: $327.78 | Stop: $332.08
Target: $314.24 — watching for breakdown below support.
#TSLA #ShortTrade #TechnicalAnalysis #StockMarket #TradingSetup
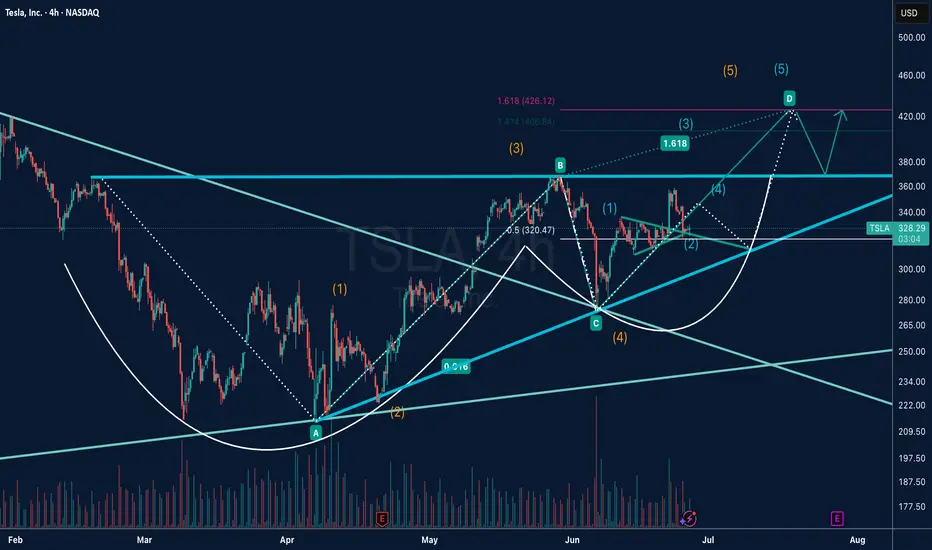
TSLA Elliott Wave Analysis | Bullish Scenario UnfoldingThis chart presents a detailed Elliott Wave analysis on Tesla (TSLA) in the 4-hour timeframe.
The price structure from the April low suggests a completed corrective ABC pattern, forming a solid wave (4) base.
A new bullish impulse appears to be underway, with wave (1) and (2) of wave (5) already confirmed.
We are now tracking the development of wave (3), which has the potential to extend toward the 1.618 Fibonacci extension zone around $426, with intermediate resistance at $406.84 (1.414 Fib).
The projected wave (5) could complete near $440, marking the end of a larger degree 5-wave impulse structure.
Key levels to watch: support near $320.47 (0.5 retracement level of wave 1–3) and resistance at $360–380 before the next leg higher.
Two possible scenarios are outlined:
Primary Path (solid lines): Strong bullish continuation toward wave D and (5).
Alternate Path (dotted lines): Short-term correction back to the trendline support before resuming the uptrend.
The chart also highlights the breakout from a long-term descending trendline and a potential cup-and-handle continuation pattern, supporting the bullish thesis.
📈 Trade Plan: Watching for confirmation above $360 to target $406 and $426+ in the coming weeks. Stops should be considered below $310 depending on risk tolerance.
NFA
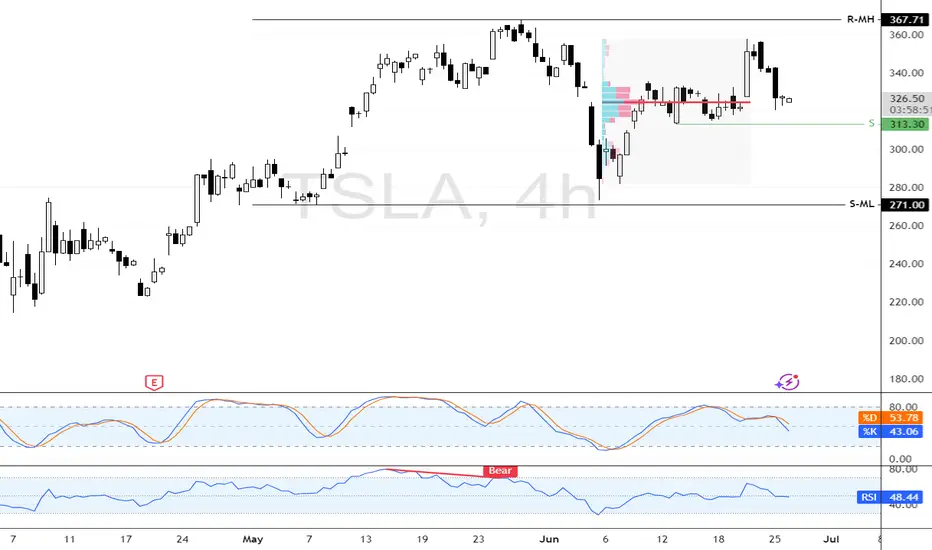
Key Support at $313.3 Holds Potential for TSLA UpsideTesla tested the order block with an average price of $325.00 in yesterday's trading session. The critical support for TSLA is at $313.3, and if this level holds, the price can target $367.71.
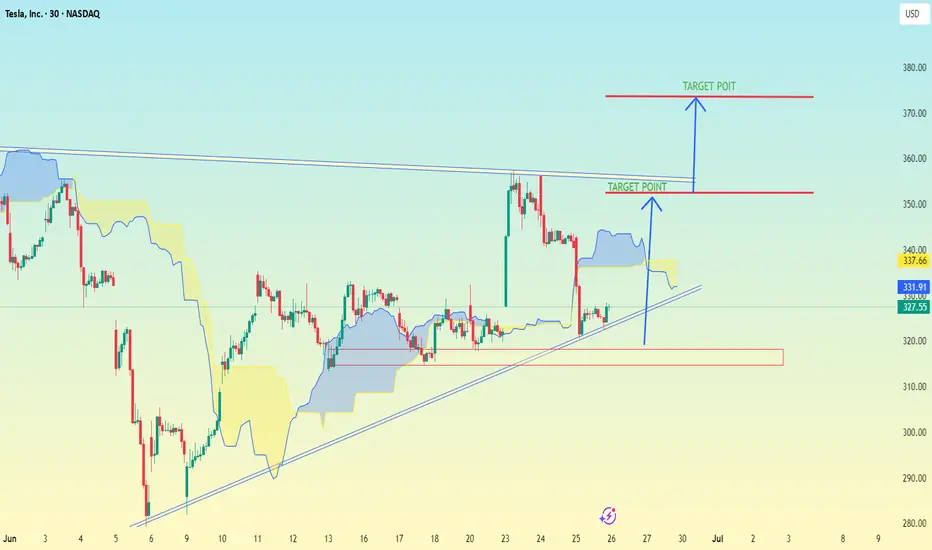
TESLA..(TSLA) 30M TIME FRAME..Tesla (TSLA) on a 30-minute timeframe using Ichimoku Cloud along with trendlines and breakout levels.
There are two target levels indicated:
---
🔵 Immediate Target Point (Breakout Target):
Price Level: ~$350
This seems to be the first breakout target if price breaks above the current resistance zone.
Based on the measured move from the ascending triangle or trendline breakout.
---
🔵 Extended Target Point (Full Target):
Price Level: ~$375–$380
This is the higher target possibly based on a full breakout move from the bottom of the triangle pattern to the top projection.
---
🟢 Current Price: ~$327.55 (at the time of the screenshot)
🧠 Suggested Trade Plan (if you’re trading this setup):
Entry: Above breakout level (possibly ~$335–$340)
First TP: $350
Second TP: $375–$380
Stop Loss: Below trendline or recent support (~$320 or slightly lower)
Let me know if you want a risk-reward analysis or SL/TP calculator based on your entry.
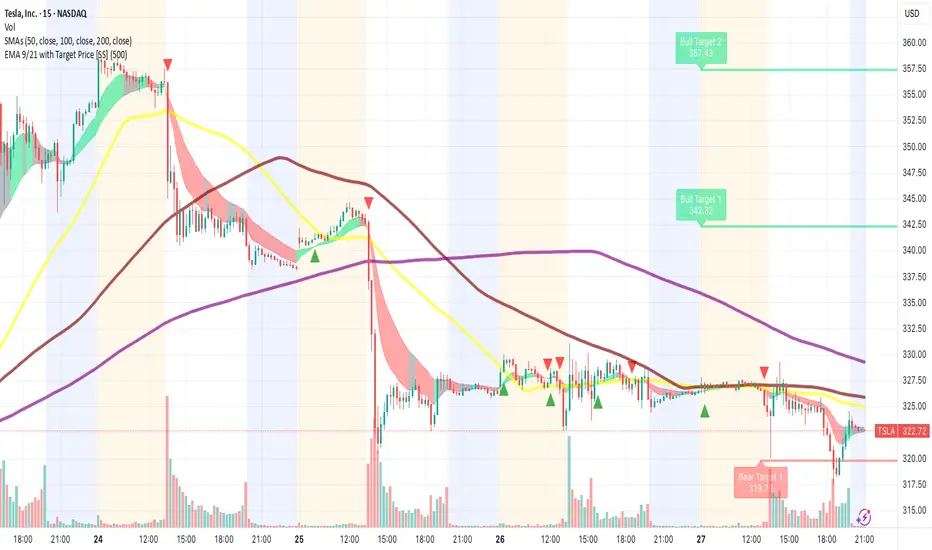
TSLA PRICE ACTION JUNE 25 2025This is the price action for Tesla. I have discussed all the levels. I have given a trade today & have discussed it thoroughly.
If you have any doubts, then feel free to Dm me or leave a comment below
NOTE:DO NOT BUY CALLS

TSLA shortPart of a larger analysis, at the moment Tsla rejected 332 B pivot and imo retesting possible b.o. area. missed gap up open, retest of highs sent 305p strike. looking to close at 310-305 tgt zone. n.f.a. g.l.h.f

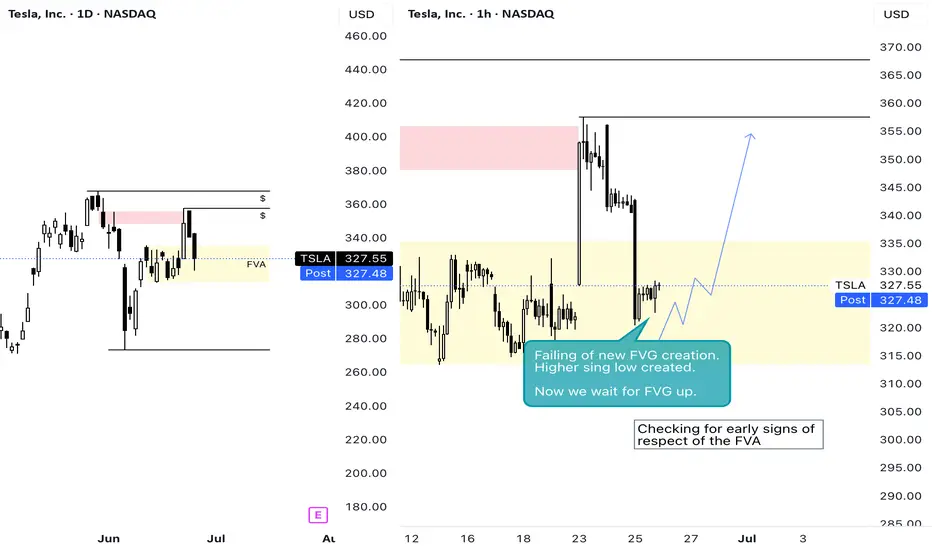
AoO Series No.3Wed - Monitoring the FVA reaction. The last swing high on the D is the last line of defence of the bearish FVG. If we run that high, there is no resistance left and we enter an area of opportunity.
Monitoring on the 4H and 1H early signs of respect of the FVA.
TSLA : Up trend is becoming weakNASDAQ:TSLA is in Up trend. But the uptrend is becoming weak. Bullish momentum may become weak here. It has pull backed from the down trend line. So It may enter in sideways trend. Down trend line may act as resistance and up trend line may act as support.
Will the Robotaxi euphoria continue to push TSLA higher?NASDAQ:TSLA pushing higher the last few days thanks to the start robotaxis. Will this rally continue? the answer is yes until the LIS gets broken.
LIS is at 311, any break below will give a retrace. If you are long, get out and get back in when the next LIS gets broken on the upside. This is efficient investing. Don't waste time doing HODL.
LIS is evolving over time, I will keep you updated on it.
This is really simple trading based on important levels. Keep following my post, so you can see it by yourself.
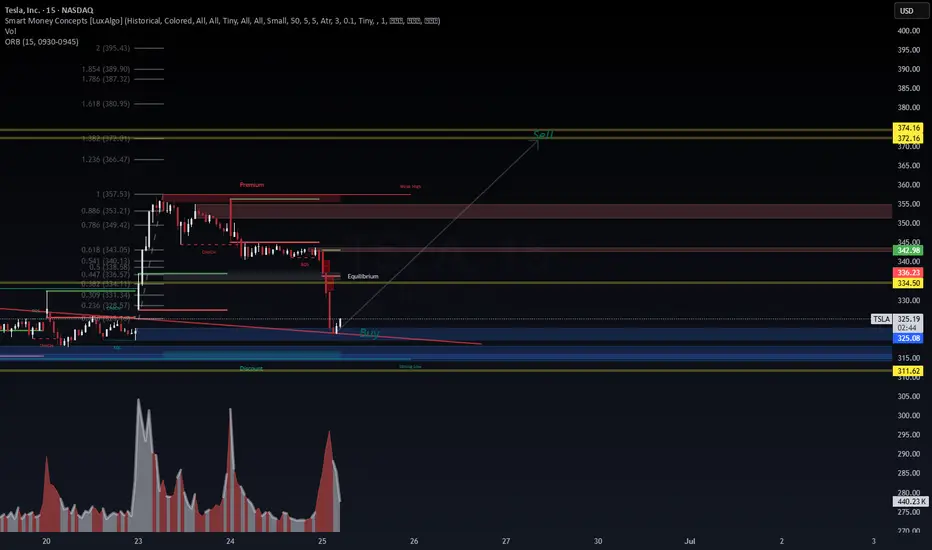
TSLA Intraday Reversal Setup | Smart Money Buy Zone HitTesla just tapped into a deep discount + strong demand confluence with SMC confirmation.
📍 Buy Zone: $311–$324
📍 Target Zone: $372.16 – $374.16 (liquidity above weak high)
📍 Midpoint (EQ/TP1): $336.23 – $345
Trade Thesis:
BOS confirmed after internal CHoCH
Price swept lows into premium discount zone
Volume spike + divergence near key Fibonacci (0.236–0.382)
Bullish intent visible if PA reclaims 336.23 (EQ)
🎯 Targeting ~15%+ intraday swing from reaccumulation. Ideal for scalpers with asymmetric R/R profiles.
🧠 Wait for confirmation – this is where Smart Money steps in.
⚠️ Not financial advice. Educational content only.
#TSLA #Tesla #SmartMoneyConcepts #SMC #LiquiditySweep #Equilibrium #Fibonacci #DayTrading #Scalping #VolumeProfile #WaverVanir #TradingView #IntradayEdge
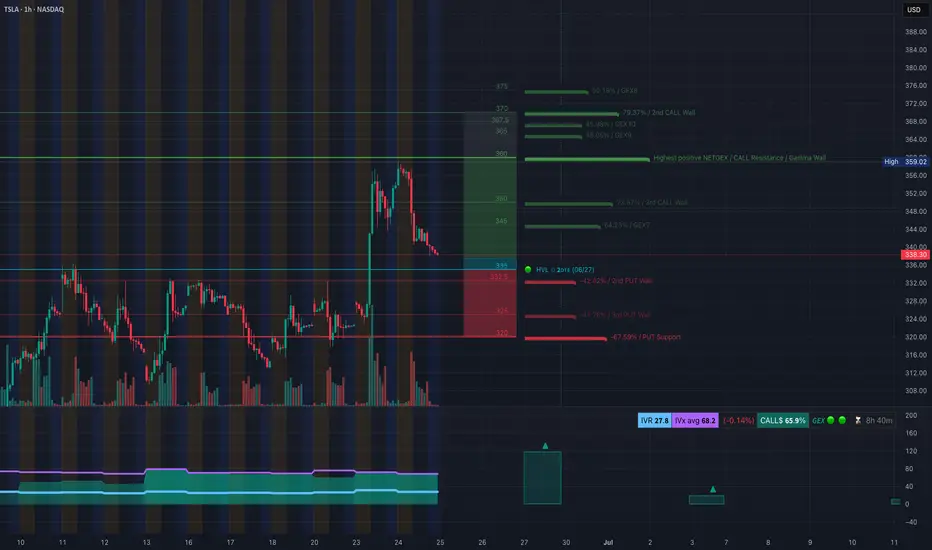
TSLA: GEX Points to Bounce Setup. Is This the Dip to Load Calls?📊 GEX-Based Options Suggestion
Gamma Exposure (GEX) data paints a bullish opportunity if TSLA holds the critical support zones:
* ✅ Key GEX Levels:
* $338: Near current price, minor GEX flip zone.
* $345–$350: Strong upward magnets (3rd Call Wall + GEX build-up).
* $359: Gamma Wall + Highest Net Positive GEX — market makers may pin price near this into end of week if bulls hold.
* 🛡️ Below Support:
* $330: Light PUT defense.
* $320: Major Put Support (-67.5%) — strong bounce zone if downside accelerates.
🔔 Option Trade Idea Based on GEX:
With TSLA near the $338 zone and GEX showing stacked resistance above + positive net exposure, a high-risk/reward call entry is forming.
* Play: Buy 345C or 350C expiring 06/28 or 07/05
* Trigger: Only if price holds $335+ and shows strength with volume bounce
* Target: $345 → $350 → potential pin near $359 (Gamma Wall)
* Stop: Close under $332 invalidates the bounce setup
🧠 Trading Setup – 1H Chart (Second Image)
From the second image, we analyze price action and structure to validate the GEX idea:
📉 Market Structure:
* Price is pulling back into a prior demand zone from $335–$338.
* Trendline support + Fair Value Gap zone + SMC CHoCH aligning at this base.
* Multiple bullish CHoCHs suggest potential reaccumulation if support holds.
🎯 Trading Plan Based on Price Action:
Bullish Case (Base Holds):
* Entry: $335–$338 zone (bounce off trendline and demand zone)
* Target: $345 (GEX level) → $348 → $350
* Stop-Loss: $331
High confluence with GEX option play. Use volume spike for confirmation.
Bearish Breakdown Scenario:
* Trigger: Loss of $331 + trendline break
* Target: $325 → $320 (strong PUT wall support)
* Put Options: 325P or 320P if breakdown triggers with momentum
⚠️ Summary:
TSLA is entering a decision zone — GEX shows bullish opportunity if $335 support holds, with upside targets toward $350–$359. But if price breaks under $330, expect a flush toward PUT support.
Patience is key — let price confirm the bounce or the break.
This setup is for educational purposes only. Trade with discipline and use stops. Always do your own research.