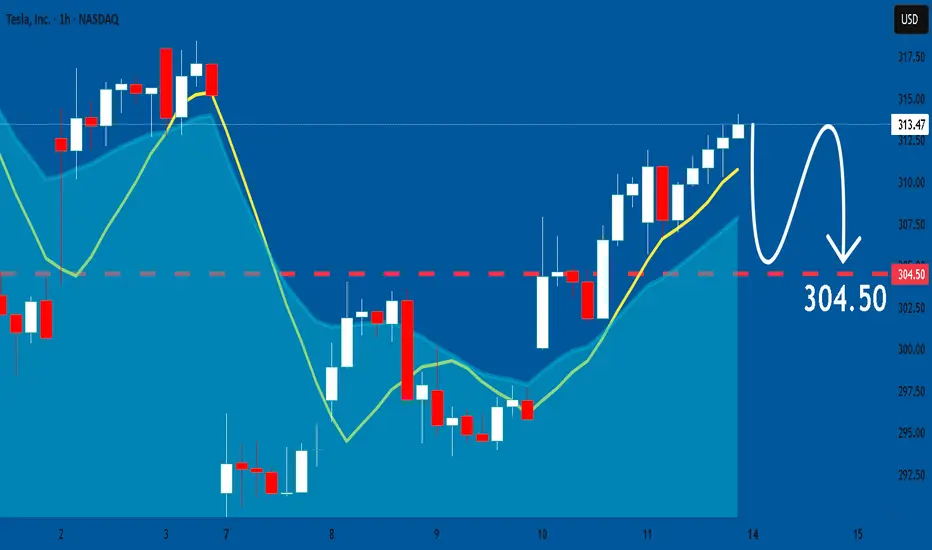
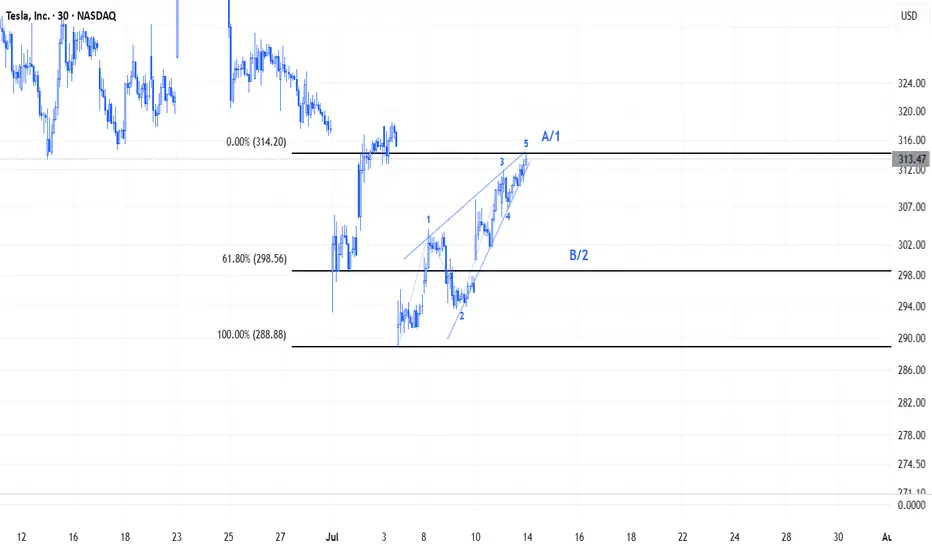
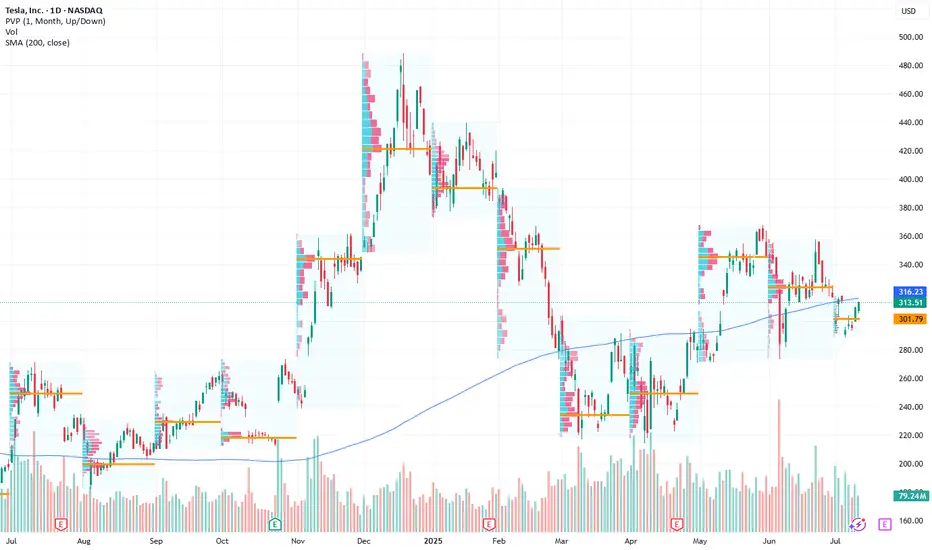
TSLA 4H Analysis – Bearish Reversal Setup📈 Trade Plan Summary
• Entry Range: 316 to 332
• Target 1: 280
• Target 2: 250
• Stop Loss: 370
⸻
📉 Type of Trade:
This appears to be a short (sell) position, since your targets are below the entry point.
⸻
✅ Risk Management Check
Let’s consider your worst-case entry (i.e., highest point in the range: 332) and best-case exit (Target 2 = 250):
• Risk = 370 - 332 = 38 points
• Reward = 332 - 250 = 82 points
📊 Risk:Reward Ratio ≈ 1:2.15 — Good setup!
TSLAD trade ideas

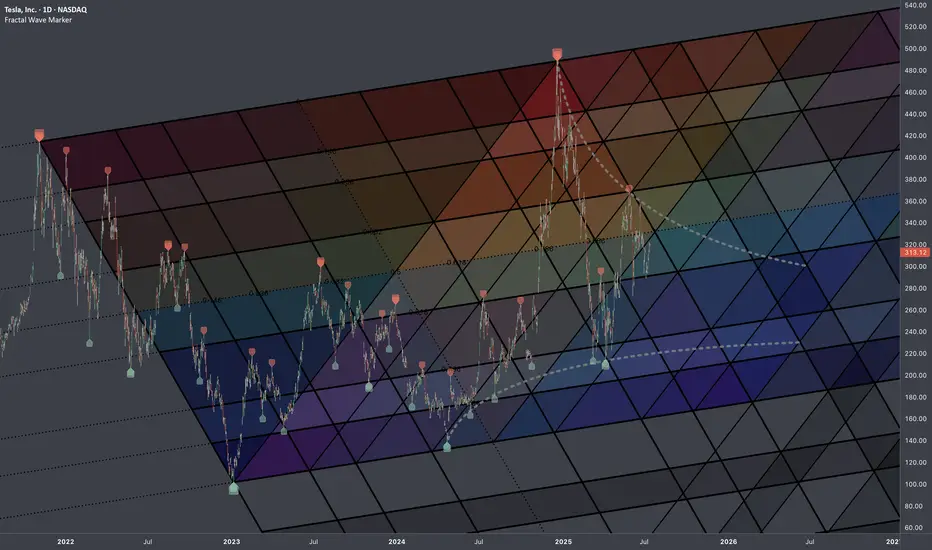
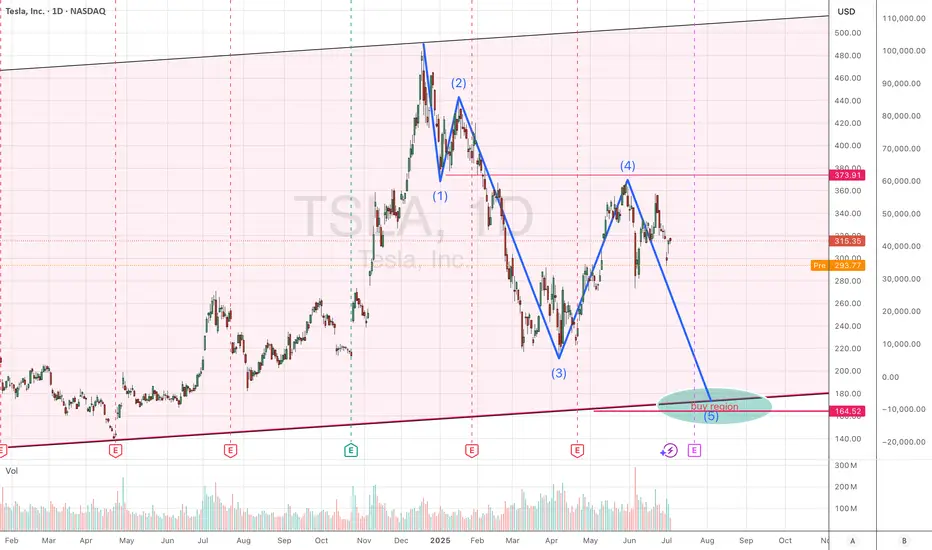
Tesla: Still Pointing LowerTesla shares have recently staged a notable rebound, gaining approximately 10%. However, under our primary scenario, the stock remains in a downward trend within the turquoise wave 5, which is expected to extend further below the support level at $215.01 to complete the magenta wave (3). This move is part of the broader beige wave c. However, if the stock continues to rally in the near term and breaks through resistance at $373.04 and $405.54, we would need to consider that wave alt.(II) in blue has already been completed (probability: 38%).
📈 Over 190 precise analyses, clear entry points, and defined Target Zones - that's what we do (for more: look to the right).

I am bullish on TSLAI have not changed my buy bias for this baby.
II will continue adding TSLA to my portfolio with $360 and $400 as my medium-term take profits.
Share your thought.
If you found this helpful, like, follow and share
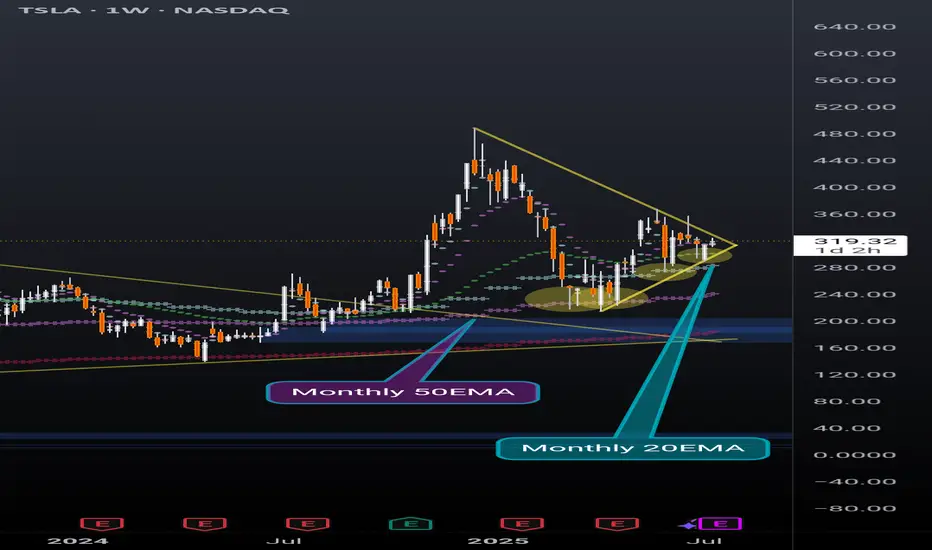
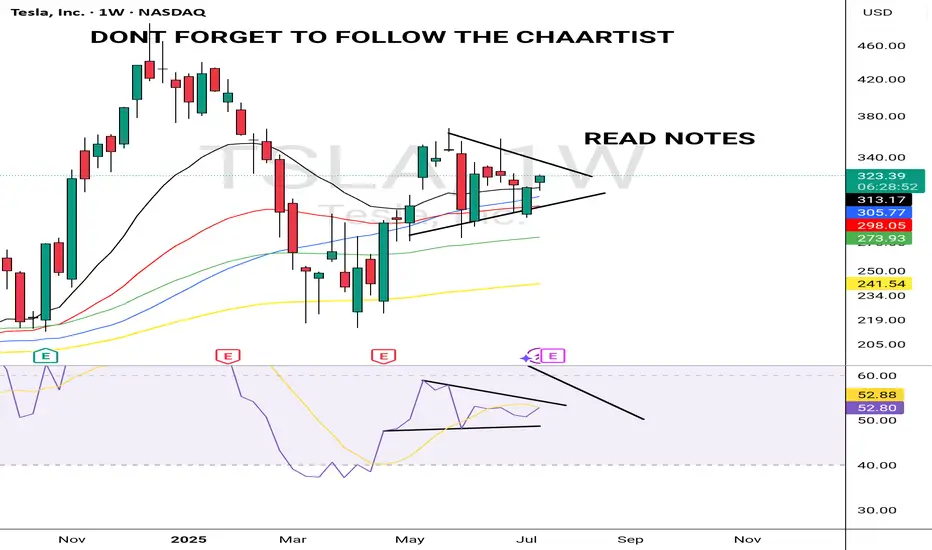
TSLA weekly coiling into something powerfulNever doubt the power of TSLA. Recently broke out of a huge pennant, and now nearing the end of another pennant while simultaneously holding support above the daily 20EMA(overlayed on this weekly chart).
Also recently found support off of the monthly 20EMA (overlayed on this weekly chart) and took 2 direct hits on the monthly 50EMA (overlayed on this weekly chart) before that and rallied up. It will take a lot to crush this setup but anything can happen. Possibly a longer pennant formation.
I'm just a cat not a financial advisor.
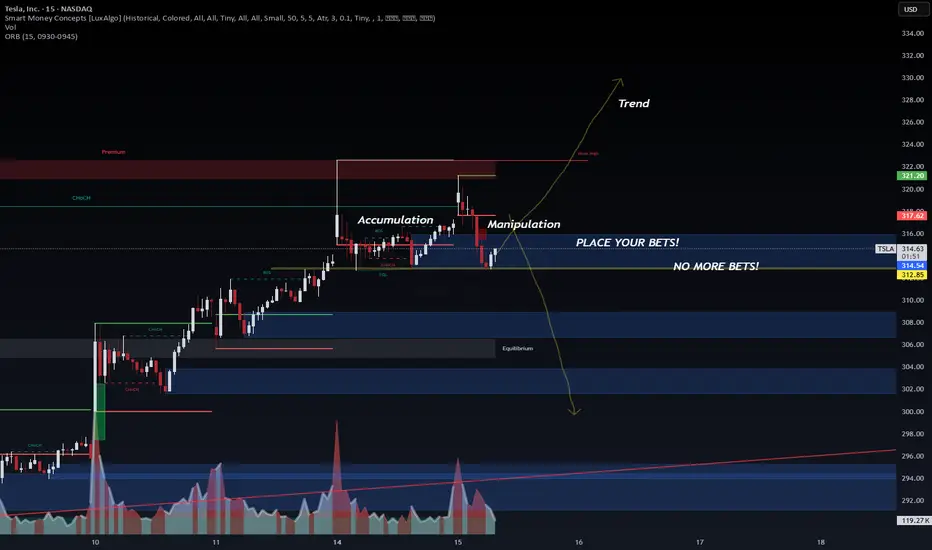
Classic accumulation, manipulation and trend @ TSLA.Looks like someone knows something, or is it just me hallucinating. Can't be both :D
Please see the chart for pattern analysis of what it seems to be a accumulation followed by manipulation, and now the stock is looking for its trend. Whatever happens, I think we are going to see a big move either direction. I am betting on the bullish side with 335 C contracts. Light position, starter.
Front-test, not fin advice.
$TSLA: Fib InterconnectionsResearch Notes
Examining interconnection type with regressive angle:
Critical points:
Mapping with 3 fibonacci channels:
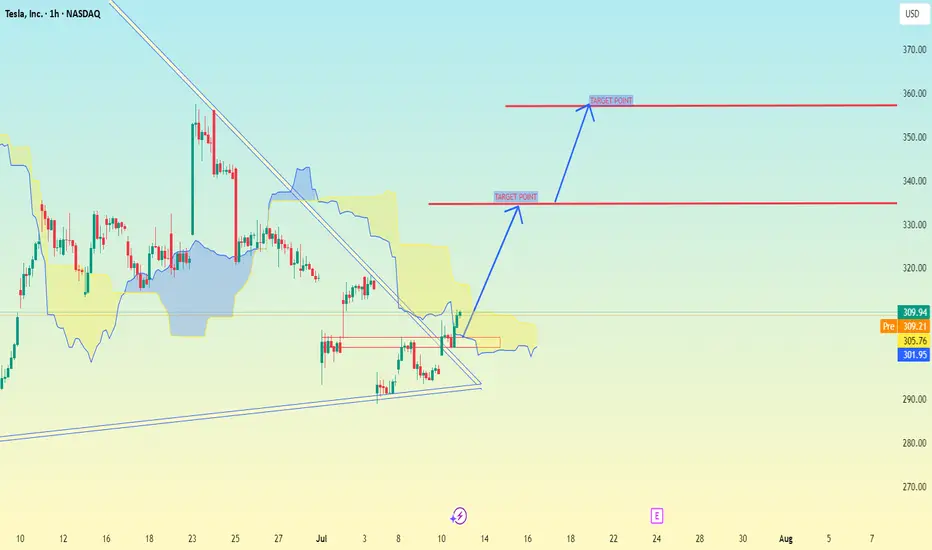
Tesla (TSLA) 1-hour chartTesla (TSLA) 1-hour chart im provided, here are the key bullish target points indicated by the chart analysis:
📈 Bullish Target Points (Upside Levels):
First Target Point:
🔹 Around $338.00 – $340.00
This level is marked as the initial breakout target, likely based on recent price structure and resistance zone.
Second Target Point (Extended Target):
🔹 Around $362.00 – $364.00
This is the higher target zone, representing a potential move if bullish momentum continues strongly. Likely aligning with a measured move or previous highs.
🧠 Context:
Price has broken out of a descending triangle/wedge pattern, a bullish signal.
It's also moving above the Ichimoku cloud, showing short-term bullish trend continuation.
Holding above the breakout level (around $305–$308) is critical to maintain upward momentum.
TESLA PRICE ACTION 7 JULY 2025I have clearly explained the price action for Tesla. I have tried my best to explain why you should not be aggressive here.
I have also discussed the stops
NOTE:DO NOT BUY CALLS

Long entry TSLA - Weekly Time FrameIt seems price failed to make a lower low that reversed the most "immediate" uptrend. Therefore, trying to play the entry against those who went short.
Lets see how it plays ouy
Tesla -> The all time high breakout!🚗Tesla ( NASDAQ:TSLA ) prepares a major breakout:
🔎Analysis summary:
Not long ago Tesla perfectly retested the major support trendline of the ascending triangle pattern. So far we witnessed a nice rejection of about +50%, following the overall uptrend. There is actually a quite high chance that Tesla will eventually create a new all time high breakout.
📝Levels to watch:
$400
🙏🏻#LONGTERMVISION
Philip - Swing Trader

Tesla could make a move here... (July 13, 2025)Tesla's 2 Day chart looks bullish here with the RSI, let's talk about it!

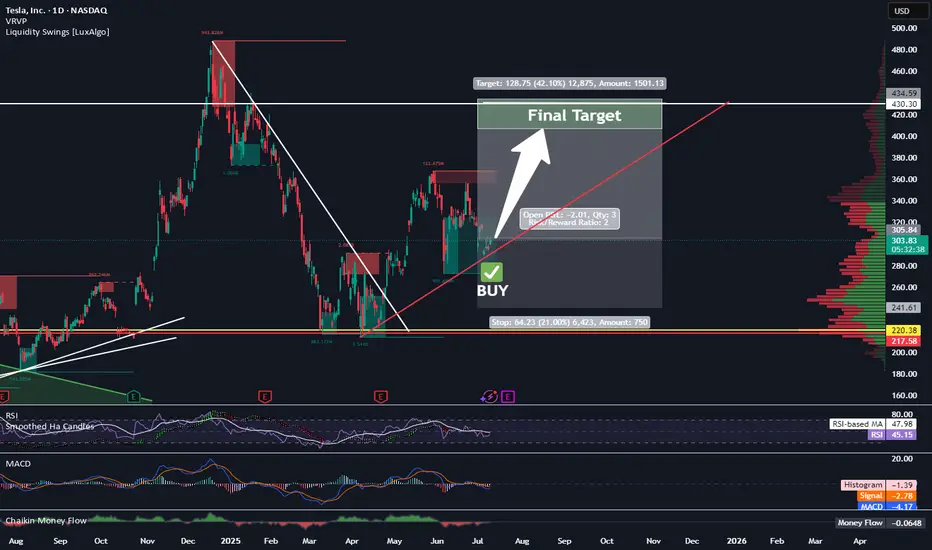
Long TESLATrading Fam,
Today my indicator has signaled a BUY on $TSLA. The technicals align. M pattern looks to have completed at strong support (RED TL) and is bouncing upwards inside of a solid liquidity block. Buyers are stepping in. I'm in at $315 and will shoot for $430 (probably taking some profit along the way). My SL is currently $241 but will trail as we enter profit.
Best,
Stew
TSLA: short as short can...below 200 certainly worth considering a reentry, but currently not sure if it will stop at 200 of 150.
TESLA: Bearish Forecast & Bearish Scenario
Our strategy, polished by years of trial and error has helped us identify what seems to be a great trading opportunity and we are here to share it with you as the time is ripe for us to sell TESLA.
Disclosure: I am part of Trade Nation's Influencer program and receive a monthly fee for using their TradingView charts in my analysis.
❤️ Please, support our work with like & comment! ❤️
Cup & HANDLE + Mini Double Bottom: $TSLA to $610 ScenarioI maintain a bullish stance on Tesla ( NASDAQ:TSLA ), supported by a compelling combination of technical patterns and strong fundamental drivers. The current chart setup reveals a Cup and Handle formation complemented by a Mini Double Bottom, both of which are classic bullish continuation patterns. These suggest a potential breakout scenario that could drive NASDAQ:TSLA to $610 by year-end.
Technical Roadmap:
Gap Fill to $408: Anticipated earnings momentum, particularly from the Robotaxi segment, is likely to propel the stock to fill the previous gap at $408.
Consolidation at $450: Following the gap fill, I expect a consolidation phase forming a “box” around the $450 level.
Breakout to $610: A decisive breakout above $450 could trigger a strong rally toward the $610 target.
***Current Key Catalysts Supporting the Bullish Thesis:
Robotaxi Expansion: Tesla’s autonomous driving initiative is gaining traction, with Robotaxi developments expected to significantly boost revenue and margins.
India Market Entry: Tesla’s upcoming launch in India opens access to one of the world’s largest and fastest-growing EV markets.
In-House Chip Development & Dojo 2 Expansion: Continued investment in AI infrastructure and custom silicon enhances Tesla’s competitive edge in autonomy and robotics.
Tesla Diner Launch: The near-completion of Tesla’s themed diner adds to brand visibility and customer engagement.
Global EV Adoption: Tesla continues to benefit from rising EV demand across multiple international markets.
Optimus Robot Hype: Growing interest in Tesla’s humanoid robot project could unlock new revenue streams and investor enthusiasm.
Favorable Macro Trends: A declining interest rate environment supports higher valuations for growth stocks like Tesla.
Institutional Accumulation: Recent trading activity suggests that institutional investors are accumulating shares within the current range.
Grok AI Integration: The integration of Grok AI into Tesla vehicles could enhance user experience and differentiate Tesla’s infotainment ecosystem.
Investment Strategy:
I recommend initiating or increasing exposure to NASDAQ:TSLL (leveraged Tesla ETF) ahead of the upcoming earnings report. This could offer amplified returns if the bullish scenario plays out. Consider accumulating further on any dips, particularly during the consolidation phase around $450.
BUY NOW NASDAQ:TSLA NASDAQ:TSLL
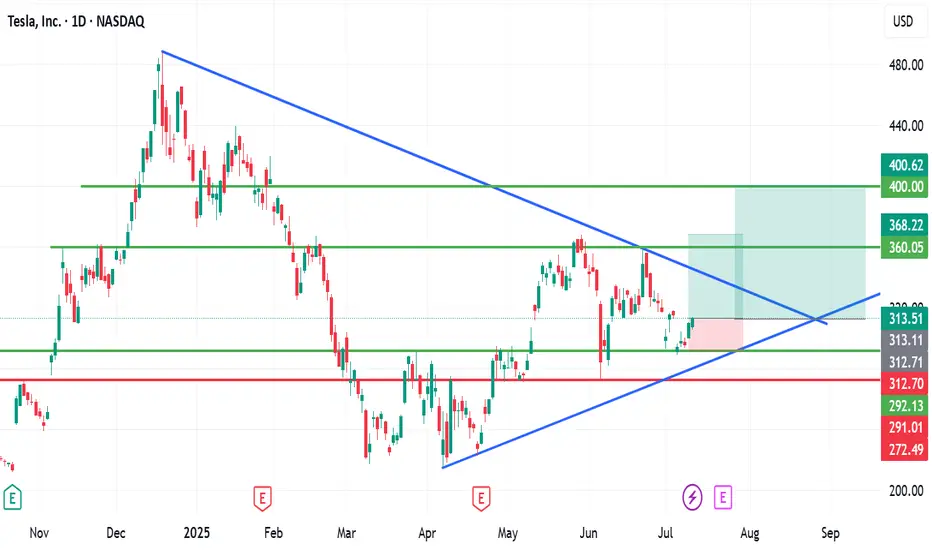
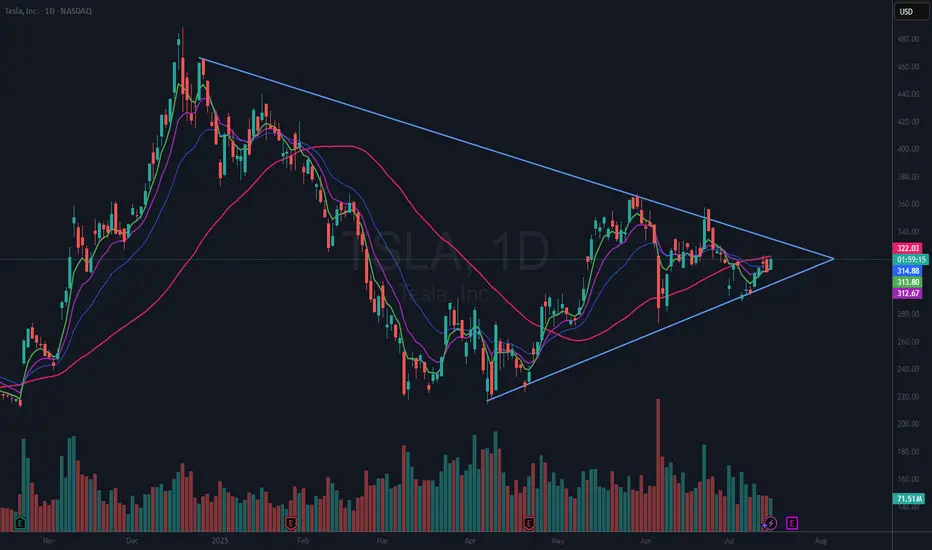
$TSLA Giant Wedging Pattern (VCP)NASDAQ:TSLA is in a giant 7 month wedging pattern. It can be seen as a VCP (Volatility Contraction Pattern) as well. These types of patterns can break either way. However, in this case we have a rising 50 DMA (red). That suggests to me that this will break to the upside.
I already have a small position in TSLA and I will look to add if or when it breaks above the 50 DMA and again if or when it breaks above the upper downtrend line. If it breaks the lower line, I am out.
Be aware that Tesla reports earnings in 7 days, Wednesday, July 23rd, after the bell.
TSLA ULLISH JULY 18 2025Tsla is lloling extremely bullish technically. If it stops me out ,il exit but my my targets from here would be $390.
Always put a SL & decide a target before your entry
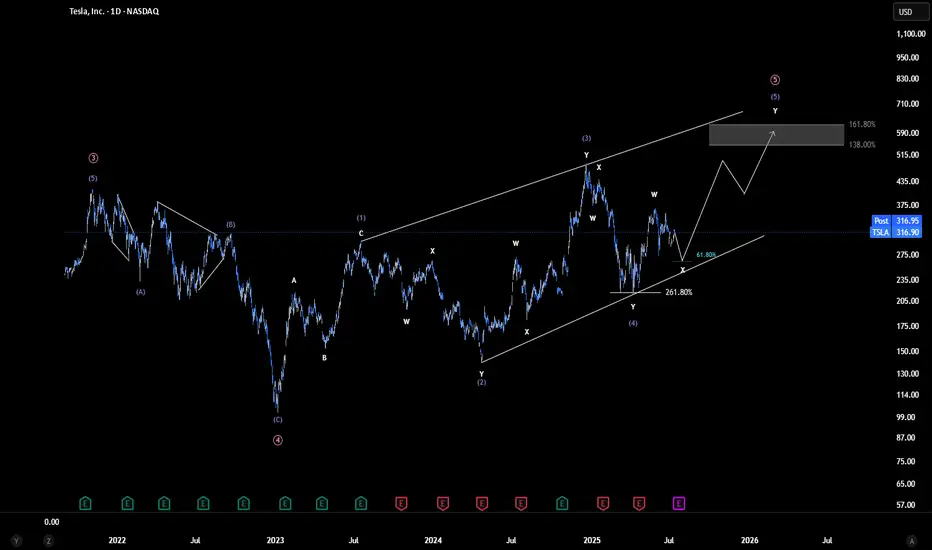
TSLA - Explosive Bounce TSLA Before the Drop? | EW Analysis My primary view is that we’re in the final stages of an ending diagonal, which could lift the price to new all-time highs, potentially between $460 and $650. Wave 4 of this structure appears to have completed after precisely tagging key Fibonacci support, and since then, we've already seen a strong bounce from that low. I’m now watching for the development of the final wave in this pattern, which could deliver gains of over 100% from current levels.
However, I’m not fully convinced by the internal shape of the diagonal so far. That’s why I’m also have an alternative scenario: in this case, the recent low may have marked the end of Wave 2 within a much larger diagonal. If true, this opens the door to a much more extended rally potentially reaching $1,000 before we see a major correction.
That said, this second scenario is not my preferred one, and a decisive break below the recent lows would invalidate both counts.
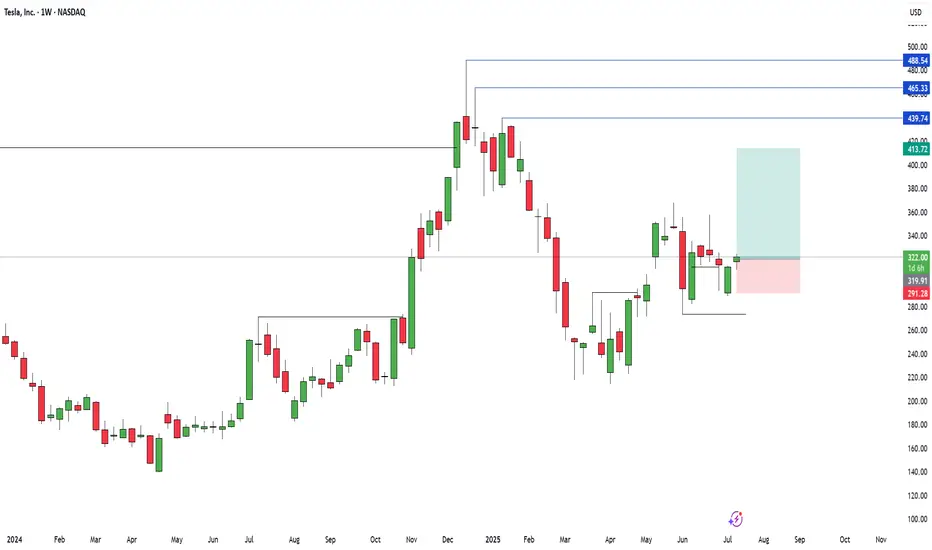
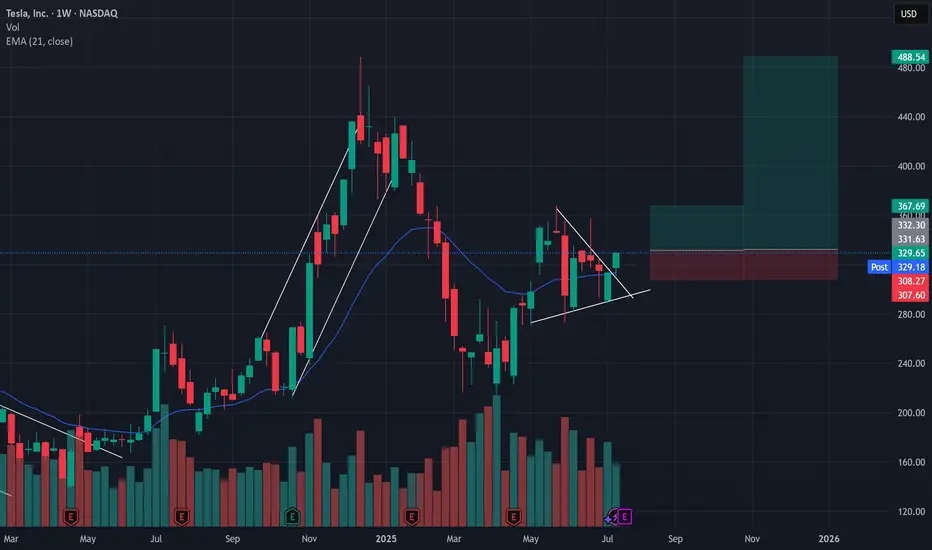
Retested Wedge Bullish Breakout = New Highs?
NASDAQ:TSLA
NASDAQ:TSLL
Tesla has currently showcased two very bullish setups with one already taking place.
Over the past 2 month we've seen TSLA swing dramatically from a high of $368 to a low of $278 while producing lower highs and higher lows AKA a wedge formation.
Wedge formations are a low probability set up and typically produce a 50/50 breakout, however there are a couple of bullish signals on the weekly chart that have kept me in my TSLL position expecting a retest of either the $368 high and/or $490.
Bullish insights -
1 - After a strong push above the 21d EMA, TSLA had a 2 legged pull back with last week being a short failure and closing above the 21d EMA
2 - this week's candle retested the breakout trendline and closed in a very bullish candle.
3 - Tesla's $488 high was an overshoot which produced a strong breakout to the low end, however there was no new high formed meaning there is a high probability chance that we will revisit ~$500.
Trade set up Idea:
If next week's candle forms higher than this weeks bullish candle, target is $368, Stop loss is set at $306 for a 1:1.5 Risk vs reward.
Or
If next week's candle forms higher than this weeks bullish candle, target is $348, Stop loss is set at $306 for a 1:6.5 Risk vs reward.
I'm holding for the second one ;)
Current position - 7400 shares of TSLL
TSLA Elliott Waves We can clearly see that a Leading Diagonal is formed on TSLA's chart.Leading Diagonal usually occurs on Wave A or Wave 1.After this chart pattern, a correction often follows reaching nearly the 61,2% fib levels of the Diagonal
Tesla’s Next Move: Bullish Play Amid AI and Volatility Current Price: $313.51
Direction: LONG
Targets:
- T1 = $319.00
- T2 = $329.15
Stop Levels:
- S1 = $307.75
- S2 = $303.60
**Wisdom of Professional Traders:**
This analysis synthesizes insights from thousands of professional traders and market experts, leveraging collective intelligence to identify high-probability trade setups. The wisdom of crowds principle suggests that aggregated market perspectives from experienced professionals often outperform individual forecasts, reducing cognitive biases and highlighting consensus opportunities in Tesla.
**Key Insights:**
Tesla’s recent AI innovation and its expanding robo-taxi footprint signal long-term growth potential while short-term volatility requires strategic entry points. Market sentiment has significantly improved with positive news about the integration of Gro 4 AI, enhancing Tesla’s autonomous vehicle advancements. Trading at critical levels, Tesla offers a potential buying opportunity near key support zones.
The rallying investor focus on Tesla’s technological edge places it among the leaders in automation-driven growth. Despite macroeconomic pressures, Tesla’s proactive efforts in leveraging cost efficiencies and scaling autonomous solutions are helping to sustain bullish momentum.
**Recent Performance:**
Tesla demonstrated notable resilience during a turbulent earnings season, holding strong amidst mixed market signals. Recent delivery figures reflected a 13% year-over-year decline, which stirred concerns. Yet, the stock was buoyed by positive AI-related news and the market-wide optimism surrounding automation technologies, enabling Tesla to maintain its pivotal price range.
**Expert Analysis:**
Analysts acknowledge Tesla’s robust innovation pipeline centered around driver assistance and robo-taxi functionality powered by the Gro 4 AI platform. Concerns related to Elon Musk’s focus and governance have tempered enthusiasm for some traders, but these have largely been offset by Tesla’s strategic actions to sustain revenue and growth. Tesla’s prominent role in setting the market narrative for autonomous vehicles and broader EV adoption ensures ongoing support from long-term investors.
Tesla’s recent moves are growing investor confidence as it seeks to hedge against broader economic uncertainties and mitigate risks around regulatory changes. Its expansion strategy continues to highlight its leadership within the EV space, while early adopters of its AI-driven solutions may set the pace for sustainable revenue expansion.
**News Impact:**
The integration of Gro 4 AI is expected to significantly enhance Tesla’s robo-taxi and autonomous vehicle functionality, enabling it to capture market share in urban mobility services. Tesla’s announcement of an expanded robo-taxi fleet targeting key metropolitan areas could help offset delivery declines and drive future recurring revenues. While concerns about Elon Musk’s governance persist, ongoing innovation continues to support Tesla’s bullish outlook in global EV markets.
**Trading Recommendation:**
Tesla’s current price action signals an advantageous entry point for a long position, reinforced by recent bullish news and industry-leading innovations. Short-term traders can target $319.00 and $329.15 while maintaining disciplined stop-loss levels at $307.75 and $303.60. With strong support from institutional sentiment and expanding AI applications in its product line, Tesla offers substantial upside for bullish investors.
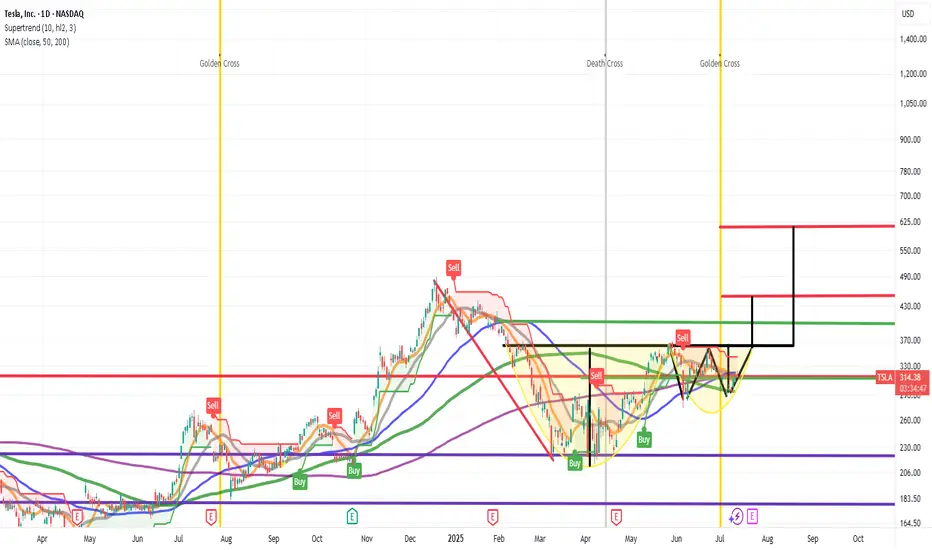
TESLA My Opinion! SELL!
My dear friends,
Please, find my technical outlook for TESLA below:
The price is coiling around a solid key level - 313.47
Bias - Bearish
Technical Indicators: Pivot Points Low anticipates a potential price reversal.
Super trend shows a clear sell, giving a perfect indicators' convergence.
Goal - 303.67
About Used Indicators:
The pivot point itself is simply the average of the high, low and closing prices from the previous trading day.
Disclosure: I am part of Trade Nation's Influencer program and receive a monthly fee for using their TradingView charts in my analysis.
———————————
WISH YOU ALL LUCK

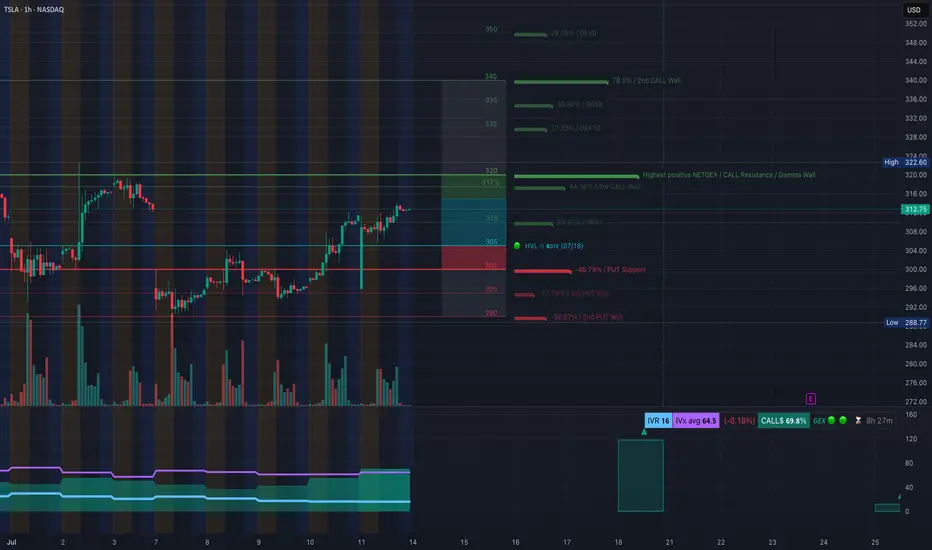
TSLA TA – Call Side Dominance Nearing Resistance-July 14TSLA GEX Analysis – “Call Side Dominance Nearing Critical Resistance 💥”
GEX Snapshot:
* Highest Positive GEX / Resistance: $320 – This is where call positioning is heaviest and likely where dealer hedging could resist further upside.
* Call Walls:
* $317.5 (44.18%)
* $320 (High NetGEX)
* $335–$340 (Intermediate resistance, weaker positioning beyond)
* Put Walls:
* $300 (48.79% support)
* $295 / $290 (3rd/2nd tier walls)
Options Oscillator:
* IV Rank (IVR): 16 (Low)
* IVx avg: 64.5
* Call Positioning: 69.8% (very bullish skew)
* GEX: 🔰 Bullish
🎯 Options Trade Setup:
Direction: Cautiously Bullish – but close to key resistance!
⚡ Aggressive Bullish Setup:
* Entry: Near $312.75 (current price)
* Strike: Buy $317.5C or $320C expiring this week
* Target: $320+
* Stop: Close below $308
* Note: Watch dealer hedging around $320. If TSLA breaks $320 with strength, gamma squeeze toward $335 is possible.
🛡️ Bearish Reversal Setup (if rejected at $320):
* Strike: Buy $310P or $305P (next week expiry)
* Trigger: Rejection at $320 + breakdown below $311
* Target: $304–$300
* Stop: Above $321
📉 TSLA 1-Hour Chart Analysis – “Breakout Zone or Fakeout Trap? Watch These Levels 🎯”
Structure:
* TSLA broke above the CHoCH and BOS zones between $308–$310. Price is consolidating under the $317.5–$320 resistance (also seen on GEX).
* There’s a clean ascending wedge/channel forming – upper boundary is near $320, and the lower trendline is near $304.
Key Zones:
* Supply Zone (Purple): $317.5–$320 (watch for rejection or breakout)
* Support: $309.8 (BOS zone), then $304 (trendline + demand overlap)
* Demand Zone: $293.5–$296 (origin of last rally)
🛠️ Trade Scenarios:
🔼 Bullish Continuation:
* Entry: Break and hold above $320
* TP1: $325
* TP2: $335
* SL: Below $311
🔽 Bearish Pullback:
* Entry: Rejection at $317.5–$320 zone and break below $309
* TP1: $304
* TP2: $296
* SL: Above $320
✅ Summary:
* GEX favors calls but $320 is a critical gamma wall – if broken, it opens room toward $335+.
* On the chart, watch the rising channel and upper resistance at $320.
* Bullish momentum is still intact unless $309 fails.
* Stay nimble: scalp calls on breakout, or prepare for a reversal put if there's rejection and structure break.
Disclaimer: This analysis is for educational purposes only and not financial advice. Trade at your own risk with proper risk management.