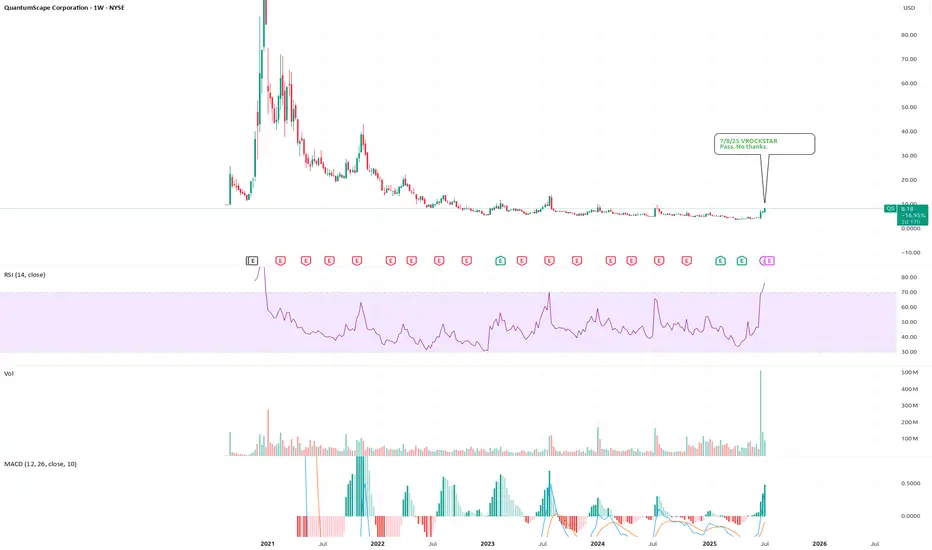
7/8/25 - $qs - Pass. No thanks.7/8/25 :: VROCKSTAR :: NYSE:QS
Pass. No thanks.
- Great story bro, company
- Does this thing continue to ape higher a la meme market? idk idc
- I think pre-revenue stuff can be interesting if there's clear visibility toward scaling revenue or the costs are contained, but let's be real... 4 years
−0.002 BRL
−2.58 B BRL
0.00 BRL
About QuantumScape Corporation
Sector
Industry
CEO
Srinivasan Sivaram
Website
Headquarters
San Jose
Founded
2010
ISIN
BRQ2SCBDR001
FIGI
BBG014XK2WN1
QuantumScape Corp. engages in the provision of energy storage solutions. The company was founded by Jagdeep Singh, Tim Holme, and Fritz B. Prinz in May 2010 and is headquartered in San Jose, CA.
Related stocks
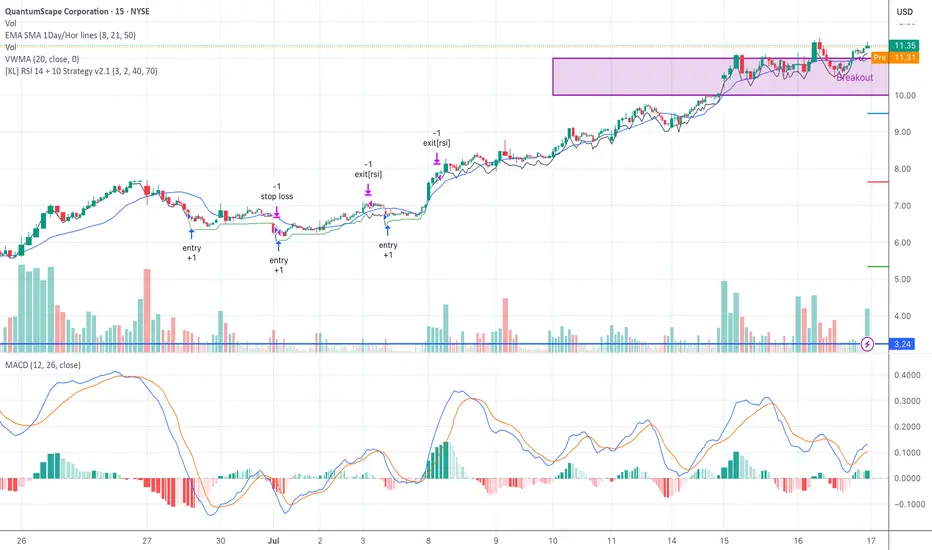
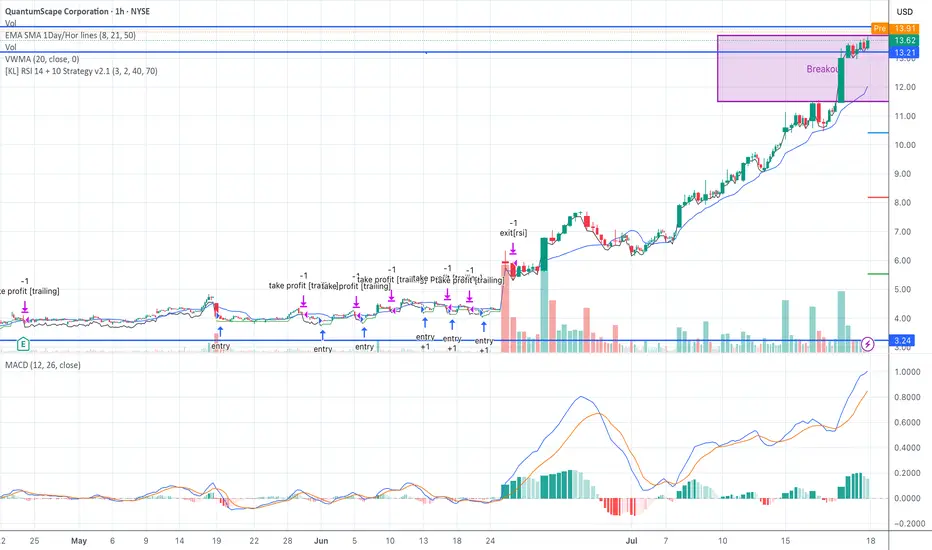
QS Breakout Setting Up — Entries Triggered, Waiting for ConfirmSeed System entries are printing on QS with trailing profit zones holding firm.
MACD crossovers confirming the move. Watching RSI cooling just under breakout resistance at $11.35.
A push through $11.50 with volume and I’m adding — slowly.
Support at $10.03, cut fast if price shows weakness.
Let
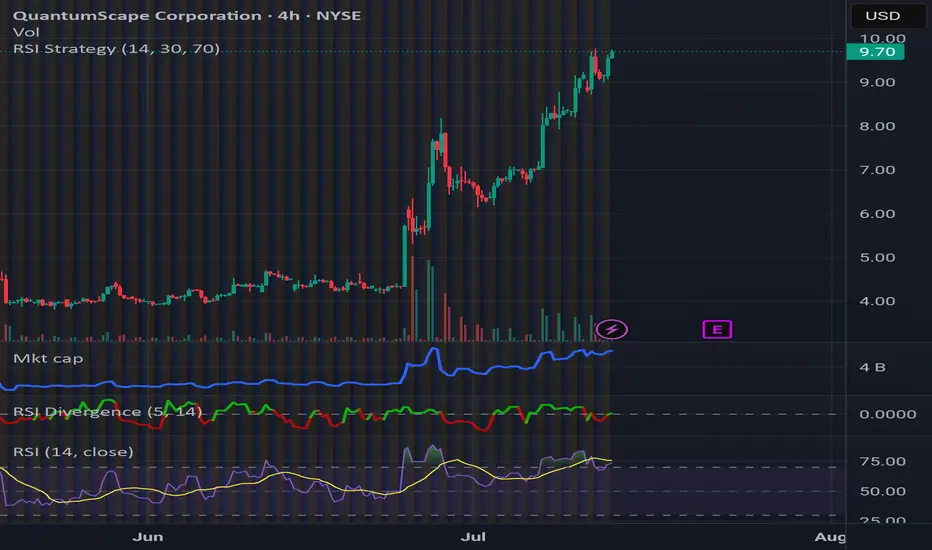
QuantumScape ($QS) | Long-Term Bet on Solid-State Battery RevoluQuantumScape has officially re-entered our radar after today's +32.72% move—driven by their “Cobra” separator scaling breakthrough. Volume surged to 171M+ confirming a major displacement event.
From a Smart Money Concepts (SMC) lens, the market structure shows repeated Change of Character (ChoCH) a
Hedge funds buy in is in playBesides hedge funds, options market is ringing bullish. Any supporting data anyone would like to share?
tradingview.sweetlogin.com
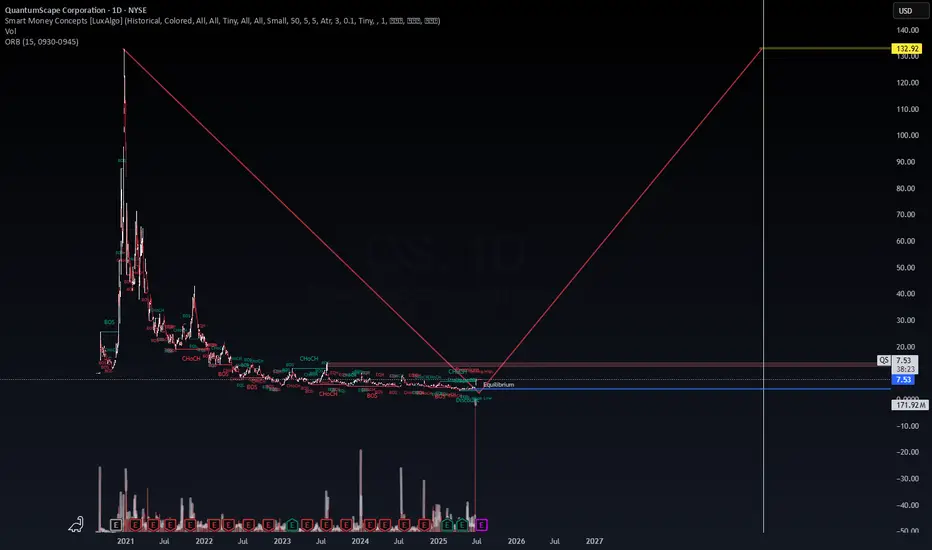
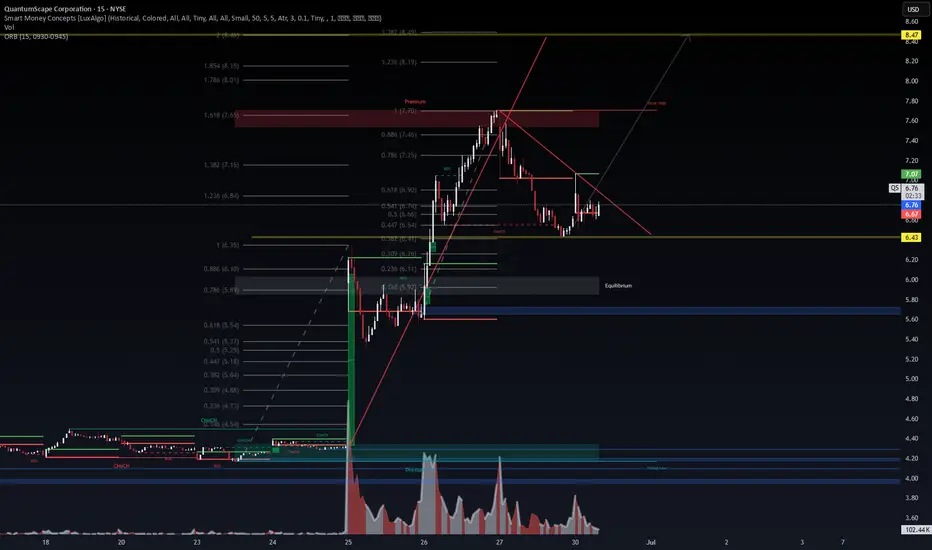
QuantumScape ($QS) – VolanX SMC Activation Zone🔍 Technical Context
QuantumScape is setting up for a potential bullish breakout after consolidating within a descending wedge and maintaining structure above the golden Fibonacci pocket (0.5–0.618 zone). Smart Money Concepts (CHoCH + BOS) have been triggered, indicating the start of institutional po
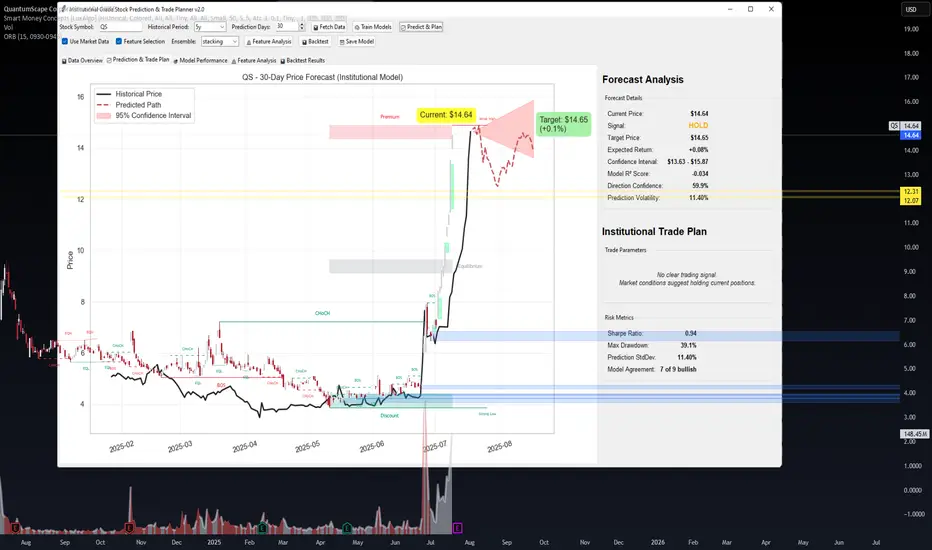
QS Forecast – Holding Premium Territory After Parabolic Move📊 QS Forecast – Holding Premium Territory After Parabolic Move
🔍 WaverVanir DSS Forecast (VolanX Protocol)
Our institutional AI model flags no fresh signal on NYSE:QS , suggesting a HOLD posture as the stock consolidates above the equilibrium band. Current price: $14.64, with a 30-day target of $1
QS Re-Tested Box Top – Waiting for $14.10 + VolumeQS is currently re-testing this morning’s high at $13.79 (box top).
VWMA and EMA alignment are bullish. MACD remains strong.
Plan: Buy above $14.10 on volume, stop at $13.20, trim at $15.00, extended target $16.50.
#QS #SeedSystem #DarvasBox #BreakoutWatch #VWMA #LiveUpdate
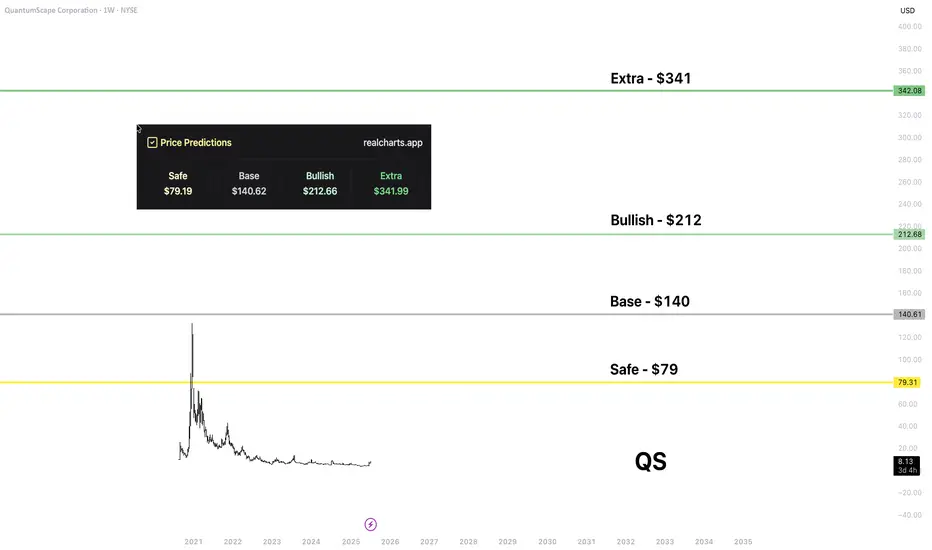
QS | Price PredictionNYSE:QS is one of the most promising assets in my stock portfolio. I expect massive upside and becoming revenue positive from 2026-27.
That level is from my platform. I think the "safe" is the most realistic in the first phase of the upside, and the "base" is quite realistic too. For the next lev
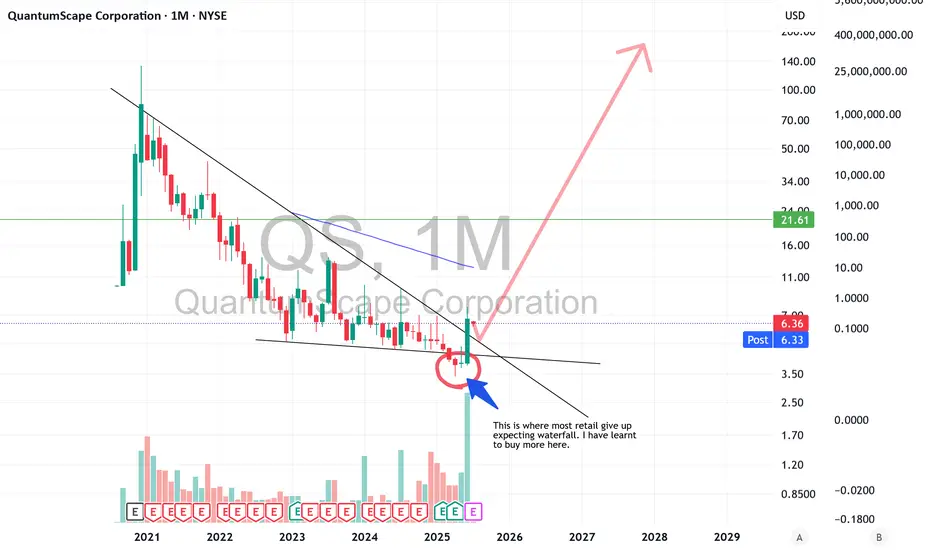
QS heading a lot higherFor those that have been following me for a while know I have been a long time holder of QS and have been accumulating even up until yesterday. Its been a long painful hold but I believe we are finally ready to begin the upward trajectory that many expected. I pointed out in the chart where most ret
QuantumScape Stock Chart Fibonacci Analysis 061125Trading Idea
1) Find a FIBO slingshot
2) Check FIBO 61.80% level
3) Entry Point > 4.25/61.80%
Chart time frame:B
A) 15 min(1W-3M)
B) 1 hr(3M-6M)
C) 4 hr(6M-1year)
D) 1 day(1-3years)
Stock progress:B
A) Keep rising over 61.80% resistance
B) 61.80% resistance
C) 61.80% support
D) Hit the bottom
E
See all ideas
Summarizing what the indicators are suggesting.
Oscillators
Neutral
SellBuy
Strong sellStrong buy
Strong sellSellNeutralBuyStrong buy
Oscillators
Neutral
SellBuy
Strong sellStrong buy
Strong sellSellNeutralBuyStrong buy
Summary
Neutral
SellBuy
Strong sellStrong buy
Strong sellSellNeutralBuyStrong buy
Summary
Neutral
SellBuy
Strong sellStrong buy
Strong sellSellNeutralBuyStrong buy
Summary
Neutral
SellBuy
Strong sellStrong buy
Strong sellSellNeutralBuyStrong buy
Moving Averages
Neutral
SellBuy
Strong sellStrong buy
Strong sellSellNeutralBuyStrong buy
Moving Averages
Neutral
SellBuy
Strong sellStrong buy
Strong sellSellNeutralBuyStrong buy
Displays a symbol's price movements over previous years to identify recurring trends.