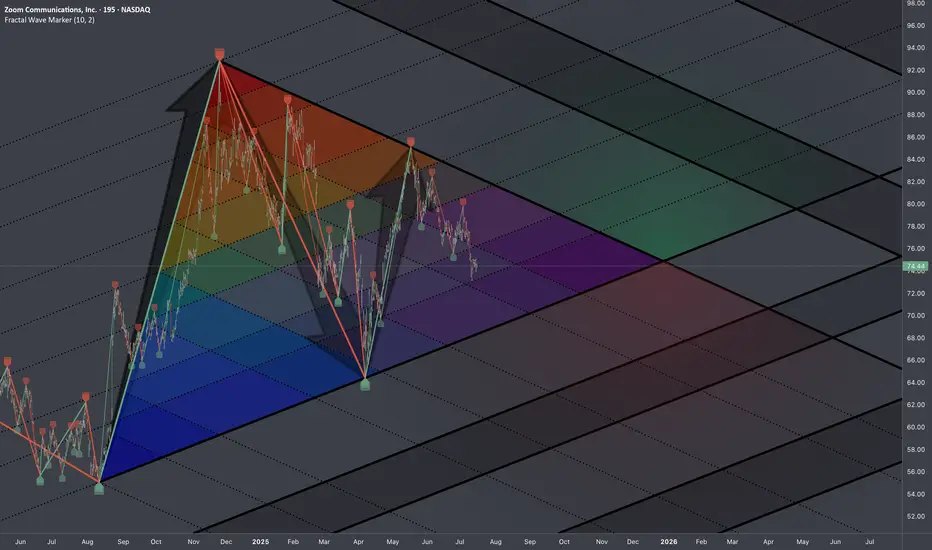
$ZM: Fib TriangleChose TF 195m (3h15m) so that each candle is half of trading session.
Research Notes
Documenting identified compression of cycles and their phases on multiple scales:
Fib Interconnections of critical points:
Z1OM34 trade ideas
ZM: Okay My time to get paid. If the market wills, my contracts will be in the money! playing some butterflies.
-Sam
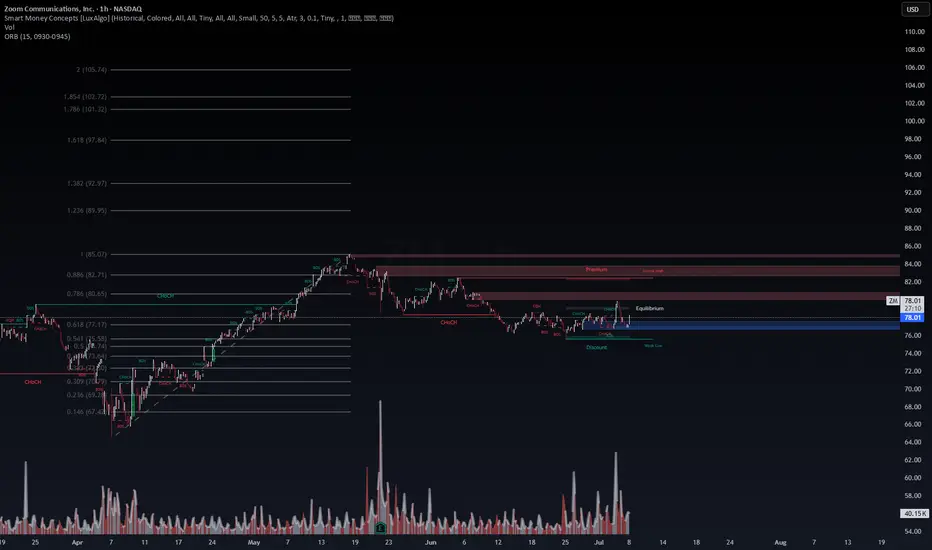
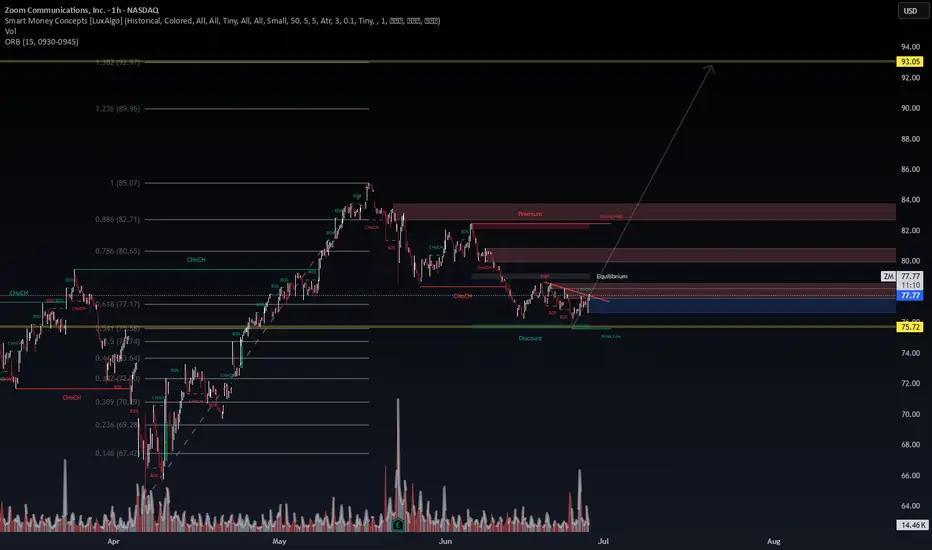
$ZM Long Setup (Probabilistic Bias: Bullish)Chart: 1H | Framework: Smart Money Concepts + Fibonacci + ORB | Date: July 8, 2025
🧠 Technical Insight:
Zoom ( NASDAQ:ZM ) has reclaimed its Equilibrium Zone (around $78) after sweeping liquidity into the Discount Area and tapping a bullish Order Block near $76. A clear CHoCH (Change of Character) signals a potential structural reversal.
🔍 Key Levels:
Support Zone (Discount Area): $75.80–76.50
Equilibrium/POI Zone: $78.00
Target 1 (Fibonacci 0.786): $80.65
Target 2 (Fair Value Gap / 0.886): $82.71
Target 3 (Strong High / Supply): $84.00–85.00
Invalidation: Below $75.30
📊 Volume Spike on July 5-8 confirms active participation near lows—suggesting possible accumulation.
🌐 Macro Context:
Recent Fed comments hint at rate pause or mild easing, boosting tech sentiment.
AI adoption remains a long-term catalyst for enterprise SaaS solutions—beneficial to Zoom’s growth narrative.
Nasdaq leadership rotation may favor ZM’s mean reversion after underperformance.
🔥 Catalyst Watch:
Earnings expected late July—option flow may front-run results.
Monitor implied volatility and ORB breakout ranges (15-min 0930–0945) for intraday confirmation.
📌 Summary (VolanX Signal Score):
Trend Reversal Probability: 67%
Risk-to-Reward: 2.8R
Bias: LONG
Conviction: Moderate to High
📉 Not Financial Advice — For Research Purposes Only
#ZM #SmartMoneyConcepts #WaverVanir #VolanX #OrderBlocks #Equilibrium #TechStocks #Fibonacci #Liquidity #OptionsFlow #MacroUpdate #TradingView #EarningsPlay #ORBStrategy #CHoCH
$ZM Multi-Timeframe AI Buy Signal | VolanX Protocol Activation📈 NASDAQ:ZM Multi-Timeframe AI Buy Signal | VolanX Protocol Activation
Zoom ( NASDAQ:ZM ) has triggered a triple BUY signal on the VolanX QuanT v3.0 across 1H, 1D, and 1W timeframes with 95% confidence each. The system highlights rare asymmetric opportunity setups:
🔹 Entry: $74.92
🔹 Stop: $73.65
🔹 Targets:
1H: $246.08 (+222.3%)
1D: $258.10 (+238.1%)
1W: $257.52 (+237.3%)
🔹 Risk/Reward Ratios: 50.06–719.41
🔹 Position Size: 2.8% per signal
🔹 Signal Reliability: All-time high
🧠 DSS Forecast:
15-day target: $75.90 (+1.7%)
30-day target: $78.68 (+5.5%)
⚠️ Risk Layer:
Annualized Volatility: 30.8%
VaR (99%): -4.62%
ZM 1D Expected Hold Time: ~81.8 days
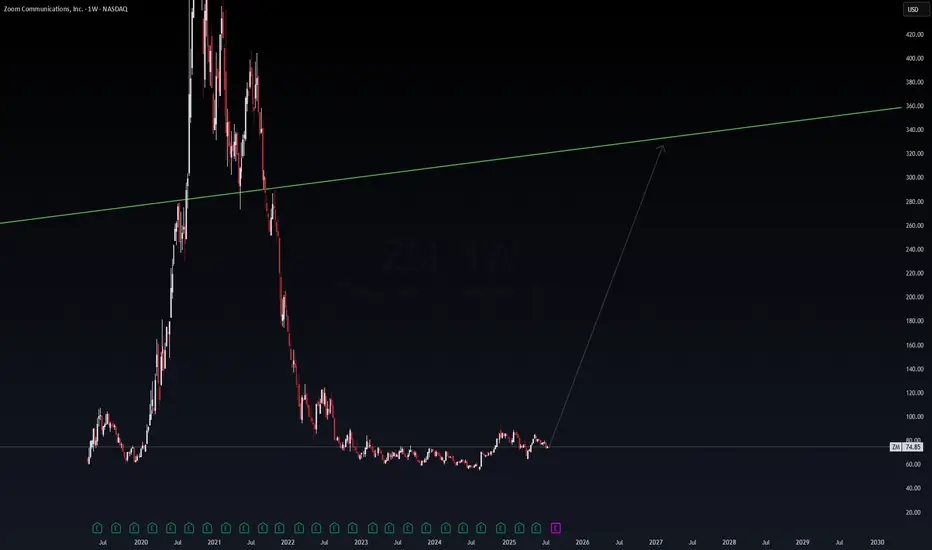
🔍 Weekly Chart Context:
After a multi-year drawdown, ZM is stabilizing at long-term accumulation zones with upside airpocket gaps above $125, then $200+. A breakout above $85 could trigger gamma squeeze potential.
🔐 VolanX Protocol Notes:
This trade aligns with our institutional-grade DSS framework. All executions tracked under WaverVanir Alpha Layer for macro-quant fusion trades. Confidence-weighted execution is key. Precision matters.
#VolanX #WaverVanir #ZM #AITrading #SmartMoney #NeuralSignals #OptionsFlow #MacroConvergence #TradingSignals #MarketStructure #DSS
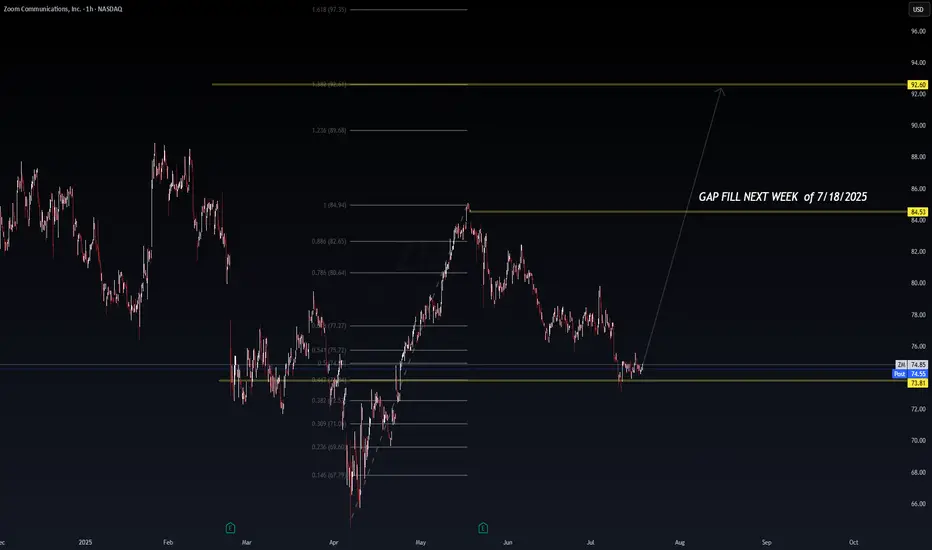
I am starting to think TradingView is Haunted. Anyways... ZM🎯 BOATS:ZM Gap Fill Setup – Targeting $84.53 by Week of 7/22
Zoom (ZM) may be setting up for a bullish gap-fill retracement off strong confluence support near $73.81. After a full fib retrace to the 0.5–0.618 zone, the current candle structure shows potential for a reversal toward the unfilled gap at $84.53.
🧠 VolanX Thesis:
✅ 0.5 Fib from March–May rally holding firm
✅ Gap from early June remains unfilled
✅ Bullish reversal candle forming at support
⚠️ Volume drying up on downside = potential exhaustion
🎯 Fib Levels to Watch:
🔹 0.618 = $77.27 (resistance → reclaim zone)
🔹 Gap Fill = $84.53
🔹 1.236 / 1.618 = $89.68 / $92.60 (momentum extension zones)
📈 Trade Idea (Illustrative):
plaintext
Copy
Edit
Entry: $74.50
Stop: $71.90
Target 1: $84.53 (gap fill)
Target 2: $89.60 (Fibonacci extension)
Gap fills often occur within 3–7 trading days when supported by fib reversal structure + buyer absorption.
Not Fin Advice! TY
📌 #ZM #Zoom #VolanXProtocol #GapFill #SmartMoneyConcepts #FibRetracement #DailySetup #WaverVanir #BreakoutTrading #TradingView
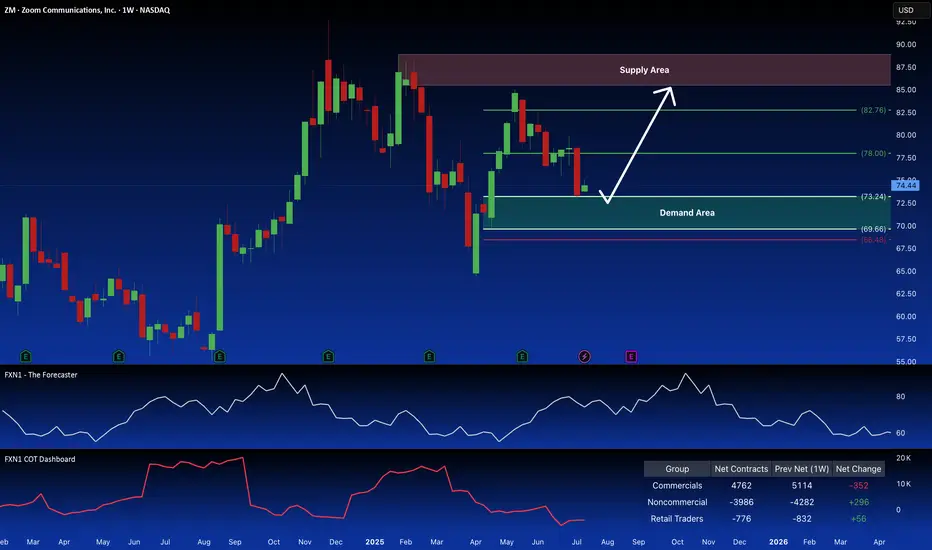
Zoom (ZM): Potential Long Setup at Demand ZoneZoom Video Communications (ZM) recently experienced a rejection at a key demand zone on its weekly chart. Non-commercial traders have increased their long positions, and forecasts suggest a potential upward trend. I'm considering a long trade setup based on a retest of that demand zone. What are your thoughts?
✅ Please share your thoughts about ZOOM in the comments section below and HIT LIKE if you appreciate my analysis. Don't forget to FOLLOW ME; you will help us a lot with this small contribution.
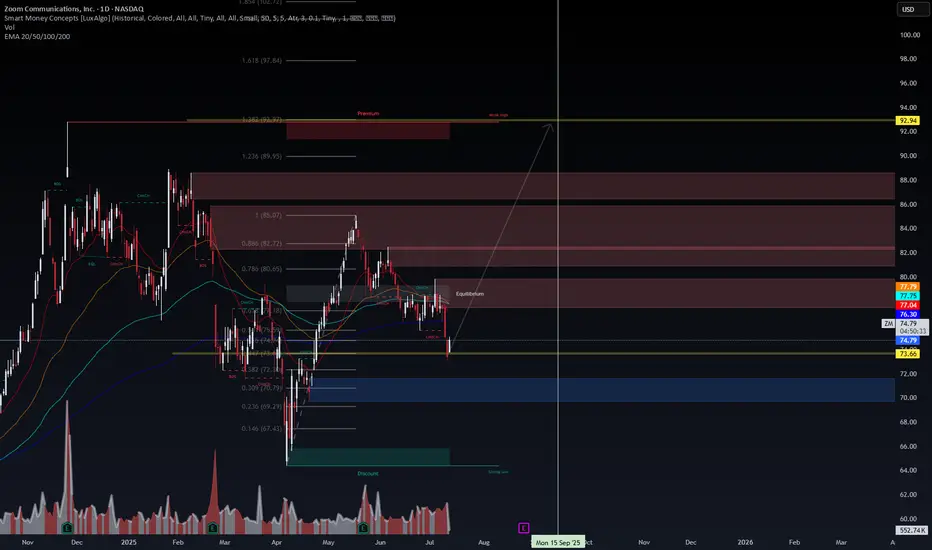
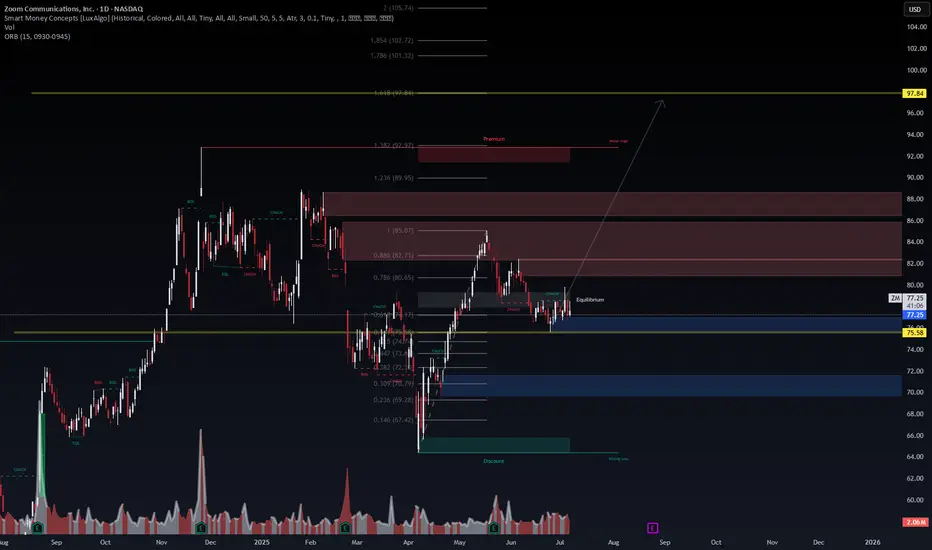
$ZM Ready to Fly — Macro Reversal in Play📈 NASDAQ:ZM Ready to Fly — Macro Reversal in Play
Timeframe: 1D | Date: July 8, 2025 | Powered by WaverVanir DSS + SMC + Fibonacci
Zoom ( NASDAQ:ZM ) is coiled at equilibrium after reclaiming key structure and defending the $75.58 level. We’re now positioned for a potential macro reversal targeting a multi-leg rally into the $97.84 zone (1.618 extension).
🔍 Technical Thesis
CHoCH Confirmed: Bullish shift in character post-accumulation
Order Block + BOS Alignment: Clear structure build from May’s low
Equilibrium Compression: Price consolidating at premium/discount boundary
Volume: Compressed + reset after post-earnings fade; volume profile supportive
Target Zones:
⚡️TP1: $80.65 (0.786)
⚡️TP2: $85.07 (1.000)
⚡️TP3: $97.84 (1.618 Extension)
Invalidation: Close below $75.58 = reassessment
🧠 Macro Context
Rates stabilizing, improving sentiment for beaten-down tech
Zoom potentially re-entering institutional rotation cycle
Options flow shifting bullish (see recent block activity on NASDAQ:ZM )
🚀 Bias: LONG
VolanX Signal Score: 73%
RR Potential: 4.1R
Conviction: High (on close > $77.50 with momentum)
This is not a trade—it’s a blueprint. We let structure lead, probabilities guide, and risk define our edge.
📛 Not Financial Advice – For Research and Strategic Education Only
#ZM #Zoom #SMC #OrderBlock #Fibonacci #BullishBias #VolanX #WaverVanir #TechnicalAnalysis #SmartMoney #LiquidityZones #BreakoutTrade #PredictiveSystems #TradingView
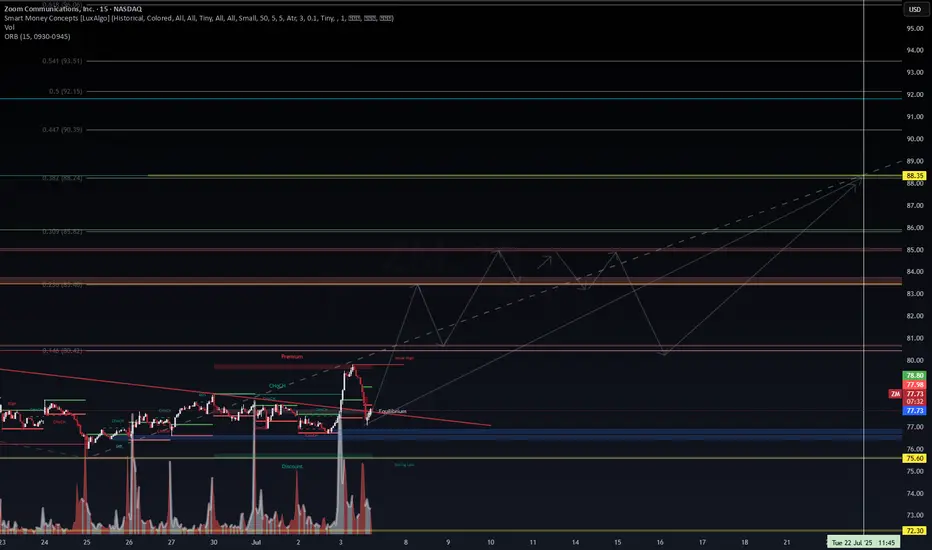
$ZM Bullish Setup — VolanX DSS ProjectionZoom ( NASDAQ:ZM ) has broken above structure with momentum and now retracing to equilibrium zones.
📈 Projected Wave Structure:
Targeting $88.35 (Fib 0.382 + SMC Premium Zone)
Potential pullbacks to $80.42 / $78.60 before continuation
Strong volume at lows signals accumulation
Liquidity sweep under CHoCH confirmed breakout leg
🔍 Key Levels:
⚡ Bullish re-entry: $77.50–$78.00 (Discount range)
🎯 Mid targets: $83.60 / $85.82
🚀 Final target zone: $88.35
📅 Timeline: Now through July 22nd, 2025
🔐 DSS + SMC alignment confirms this as a high-probability wave forecast
💡 Strategy: Long calls or butterfly lotto up to $85–88
#WaverVanir #VolanX #ZM #OptionsFlow #SmartMoney #TradingView #SMC
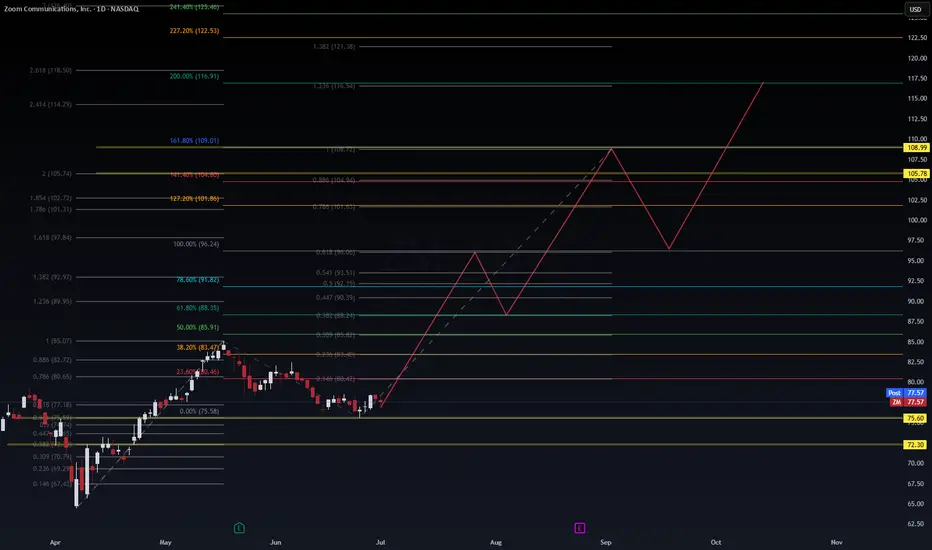
$ZM Swing Setup – Fib Expansion + Recovery Arc🔍 NASDAQ:ZM Swing Setup – Fib Expansion + Recovery Arc
Zoom is entering a Fibonacci golden arc setup, bouncing off key support ($75.60) and aiming for a multi-leg move back toward structural targets.
Trade Thesis: A successful reclaim of $85–88 range can propel NASDAQ:ZM to $105–109 with a final fib target of $122 if volume confirms.
Risk: Break below $72 invalidates the recovery arc.
🧠 WaverVanir DSS Score: 7.4/10
📌 Targets:
TP1: $85.00 (safe swing exit)
TP2: $96.24 (measured move)
TP3: $108.99–$122.53 (macro extension targets)
⚠️ SL: $72.30 | RR: 3.5:1 | Timeline: 30–60 days
#Zoom #ZM #Fibonacci #WaverVanir #Options #SwingTrade #AIQuant #TradingView
🔍 Chart Overview
Ticker: ZM (Zoom Video Communications, Inc.)
Timeframe: Daily
Chart Tools: Fibonacci retracement & extension levels, projected Elliott-style wave structure
📊 Current Price
Current Price: $77.57
Key Support:
$75.60 → Previous pivot low (likely acting as short-term support)
$72.30 → Golden Pocket zone (high probability bounce area)
Key Resistance Zones:
$85.00 → 1.0 Fib retracement (former high)
$88.35 → 61.8% retracement of previous drop
$96.24 → Full 100% retracement
$105.78 → 1.272 extension (strong resistance)
$109.01 → 1.618 Fib extension
🧠 Technical Structure & Path Forecast
A potential ABC impulse wave is drawn in red:
Leg A → Target ~$92–96 range (50–100% retracement zone)
Pullback (leg B) → ~$88–90 support retest
Leg C rally → Major resistance at $108.99, possibly extending to $116.91 or $122.53 in a blow-off top
Confluence Targets:
$105.78 (1.272 extension) aligns with a major Fib cluster and resistance zone
$109.01 (1.618 extension) also aligns with previous structural highs
Final target ~$122.53 (2.272 extension) is ambitious but possible under bullish macro conditions
⚠️ Risk Management
Stop-Loss (short-term): $72.30 (loss of this level invalidates the bullish thesis short-term)
Entry Zones:
Swing long: $75.60–$77.50 (ideal accumulation range)
Momentum entry: above $85.00 (break of structure)
Downside Risks:
Break below $72.30 opens the path to $67.00 and possibly lower
📈 Probabilities (Based on WaverVanir DSS)
Target Level Type Probability
$85.00 Local resistance 80%
$96.24 Measured move 100% 68%
$105.78 1.272 Fib extension 55%
$109.01 1.618 Fib extension 45%
$122.53 2.272 Fib extension 25%
ZM: Uncanny Feeling this is going to explodeStrategy Type: Debit Call Spread (defined risk, favorable skew)
Thesis: Price moving from $77 toward the $85–$93 liquidity zone
🧾 Setup Details (as of $77.76 spot)
📅 Expiry:
August 16, 2025 (standard monthly expiration – gives time for move to unfold post-earnings and macro catalysts)
⚙️ Structure:
Buy 80 Call @ ~$3.70
Sell 90 Call @ ~$1.10
Net Debit (Cost): ≈ $2.60 per spread
Max Profit: $10 spread - $2.60 cost = $7.40
Max Loss: $2.60
Break-Even: $82.60
📈 Profit Scenario
Stock Price @ Expiry P&L per spread
≤ $80 -100% loss (-$260)
$82.60 Break-even
$90 Max gain ($740 profit)
≥ $93.05 Full liquidity sweep – still capped at $90
🧮 Risk-Reward
R:R Ratio: 2.85:1
Probability of Profit (est.): ~42% (based on delta skew + chart breakout zones)
Implied Volatility Rank: Neutral-high (useful for buying debit spreads)
🛡️ Why Debit Spread?
Controlled risk — limited to your premium paid ($260)
Aligns with structure shift and price roadmap toward $85–$93
Selling 90C offsets premium and reduces theta decay
🪛 Adjustments
If ZM breaks above $80.65 with volume, consider adding a second spread or switching to long calls for momentum
If ZM fails to hold $75.72 key level, cut or hedge with short-dated puts (70P)
🔁 Alternate (More Aggressive) Play:
Buy August 85C outright
Cost ≈ $1.30
Break-even ≈ $86.30
Max reward: unlimited
Use if expecting strong earnings surprise or short squeeze
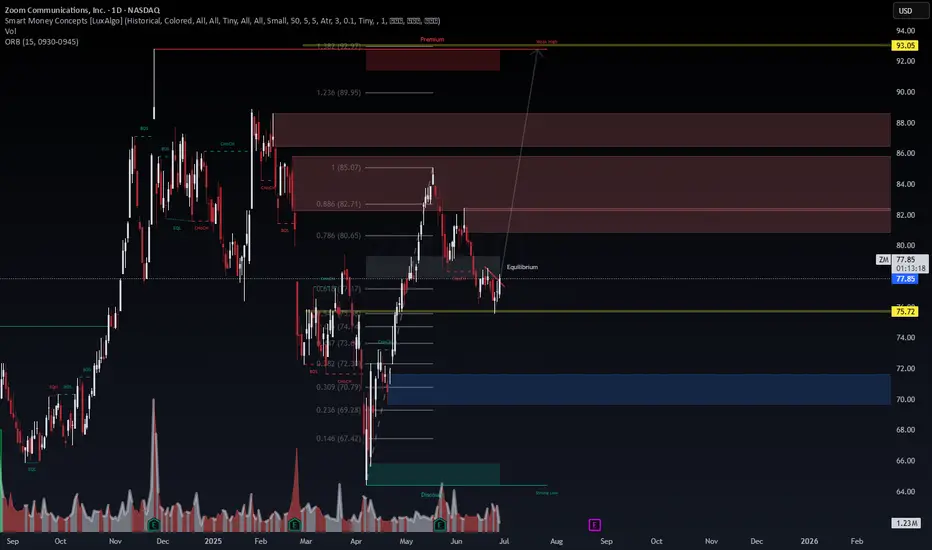
Zoom Communications ($ZM) – Discount Demand Zone Reversal in ProAfter an extended corrective move, NASDAQ:ZM has tapped into the 0.618–0.786 discount Fib zone around $75.72, aligned with BOS (Break of Structure) and CHoCH (Change of Character) signals. Price structure suggests a bullish reversal with upside targets of $87–$93 over the coming weeks.
🔍 Technical Overview (1H):
📉 CHoCH > BOS confirms early accumulation
🧊 Price swept weak low, reclaimed equilibrium
🟦 Demand zone defended at $75.72
🎯 Targets:
TP1: $82.71 (0.886 Fib)
TP2: $85.07 (1.0 Fib)
TP3: $89.95–93.05 (1.236–1.382 extension)
🤖 WaverVanir DSS Forecast (AI-Powered):
📈 15-Day Prediction: $79.99 (+3.9%)
🚀 30-Day Prediction: $87.35 (+13.5%)
🔵 Sentiment Score: 38/100 (recovering from bearish cycle)
🌐 Macro + Fundamental Catalysts:
Tech Rotation into Discounted SaaS Stocks: AI fatigue has redirected capital into cash-flow positive companies like Zoom.
Lower Treasury Yields: Easing yields support long-duration growth names.
Upcoming Earnings (Q2): Low expectations + short interest = potential squeeze on positive surprise.
Enterprise AI Integration: Zoom’s recent push into workplace AI could unlock new investor narratives.
Buyback Potential: Zoom has a strong balance sheet with buyback flexibility, increasing downside protection.
📌 Trade Plan:
🔹 Entry: $76.00–$77.80
🔻 Stop Loss: Below $75.00
🎯 Target: $87.00–$93.00
🛑 Invalidation: Loss of BOS and demand zone breach
✅ Bias: Bullish Recovery Setup
📆 Time Horizon: 15–30 days
📈 Style: Swing / Position
🧠 For educational purposes only – not financial advice.
🔗 Posted by WaverVanir_International_LLC
(APA7: TradingView, 2025)
ZM BUYBUY ZM at 75.0000 or 73.0000, riding it back to 92.0000 to 101.0000 for Profit Target, Stop Loss is at 69.0000!

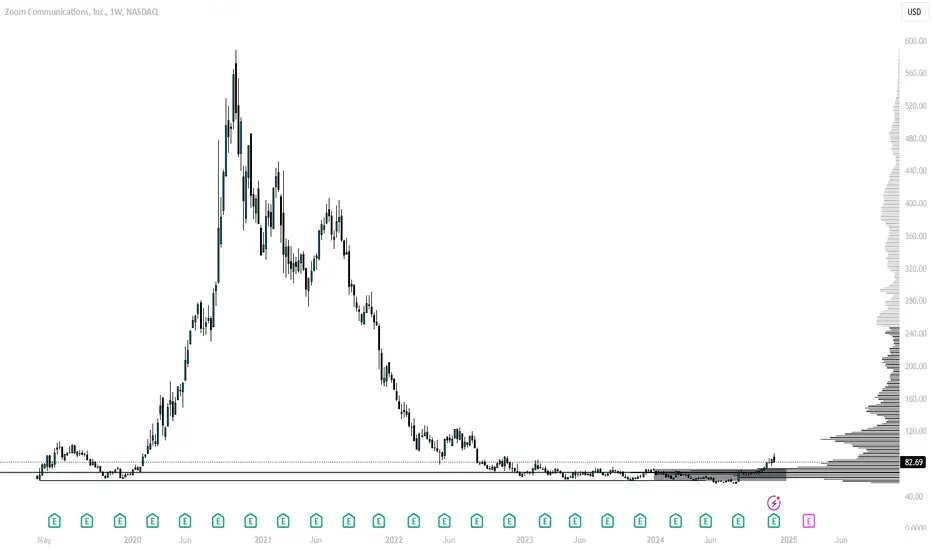
Pandemic darling now at DEEP value Zoom who was a big beneficiary of the pandemic but unlike other stay at home stocks, this one actually makes money. I think a markup phase has begun and I am currently long, UNLESS there's a break of recent lows and the 200d SMA.

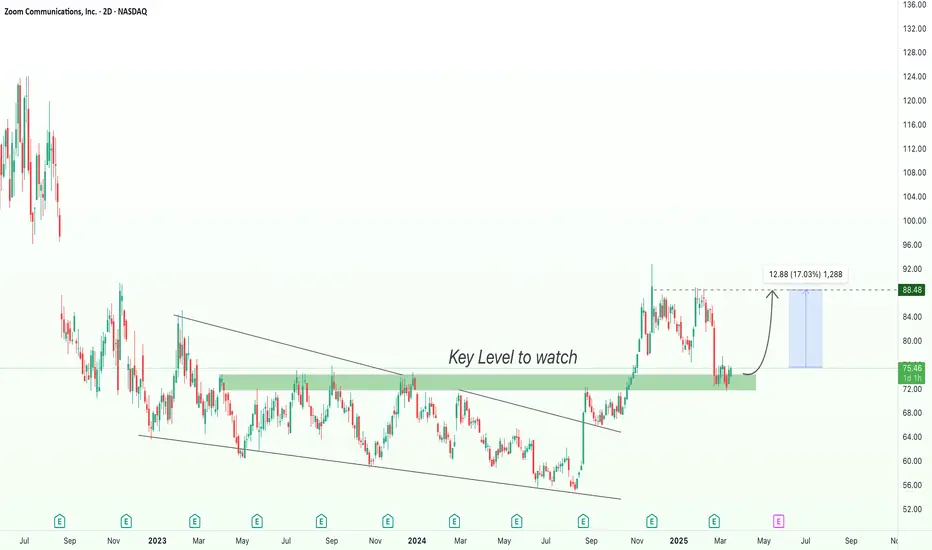
Zoom (ZM) – Is There Upside Ahead?🔹 Analyst Expectations:
- Low Target: $75.00 (current price)
- Average Target: $91.64
- High Target: $115.00
🔹 Fundamental View:
- Zoom posted stronger-than-expected earnings, but the stock pulled back due to cautious revenue guidance.
- Financial health remains solid, and long-term demand for remote communication tools is stable.
- Analysts see potential upside, but the stock needs to regain momentum.
🔹 Technical Setup:
- Zoom is trading near strong support at ~$75.
- A break above $88-$92 could trigger more upside toward analyst targets.
- If support holds, there’s room for a 17-21% move up in the coming months.
💡 My personal target for Zoom is $88.50 which is the previous high, right before the earnings report, which as mentioned above, was positive! This represents a 17% growth opportunity in the short term.
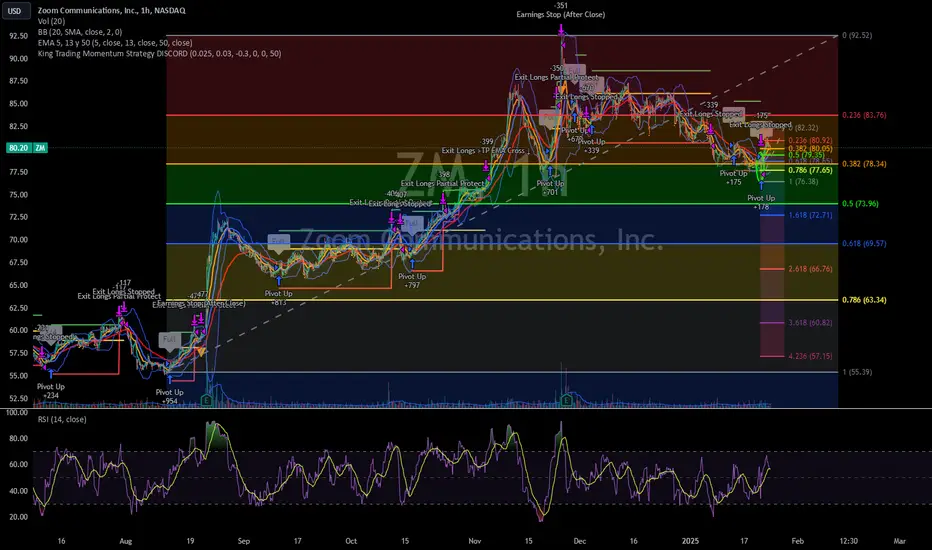
Time to "ZOOM" back to winnings ways?On Thursday afternoon, the King Trading Momentum Strategy triggered alongside eleven other alerts, followed by five more on Friday. This flurry of signals doesn’t exactly indicate a “bearish” sentiment, but as always, the market has its unpredictable ways! With markets approaching all-time highs, I’ve been cautious, limiting my positions to just a few with low allocations in TNA, ADBE, PYPL, and XYZ.
When I analyzed Zoom (ZM), I noticed that it experienced a strong rally from July through the end of the year, gaining over 50%. Now, the key question is: has it finished consolidating, or is there more downside ahead?
Looking back to July, ZM’s performance suggests a classic bull flag pattern. It’s retraced to the 38% Fibonacci level, and during a two-hour window when the signal fired, the impressive “wick” formed caught my attention. Now, after a short-term pump, it’s retracing again, and I’m eyeing the 50% Fibonacci level as a potential entry point.
Unless Monday brings a major selloff due to concerns over the Fed meeting on Wednesday or the PCE data on Friday, I’ll likely use the usual morning volatility to position myself in this trade. Let’s see how this one unfolds!
The King Trading Momentum Strategy employs a robust combination of indicators: the 5 EMA crossing above the 13 EMA, RSI strength, favorable momentum measured by ADX+, and MACD confirmation. ZM, along with over 100 other equities, is integrated into this script with optimized backtested take-profit and stop-loss levels. Activating these parameters is as simple as checking a box (they’re off by default), making this strategy both powerful and user-friendly.
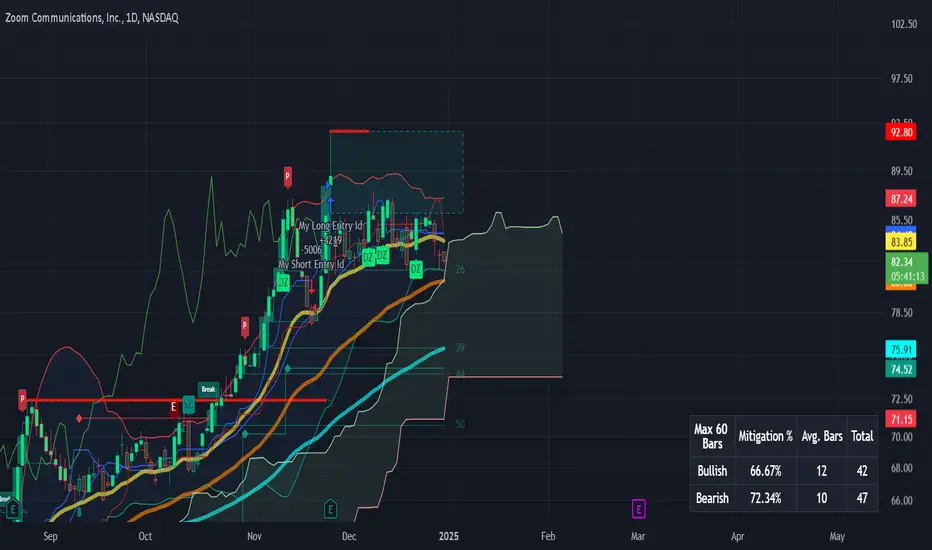
ZM - Looking for DirectionNASDAQ:ZM is currently trading below its 20-day MA and can enter the Ichimoku cloud. The volume is drying up. the next 10% upside is going to be a hard grind with supply zone in the range from 89-92. Its a tough trade and for the patient ones only. The fundamentals are strong. The technicals are now subject to market volatility. Enter if you are long; OR enter once it breaks the supply zone at 92.
ZM BreakerZM forming breaker after sweeping below IPO opening price i believe we will see a return to ATH's in the next year or two
120 is nextThis has turned bullish after long time. Target 120. I am in with round1. Will buy more if it hit high 70s or touch 50 dma. Happy Trading!!
Not a Financial Advice
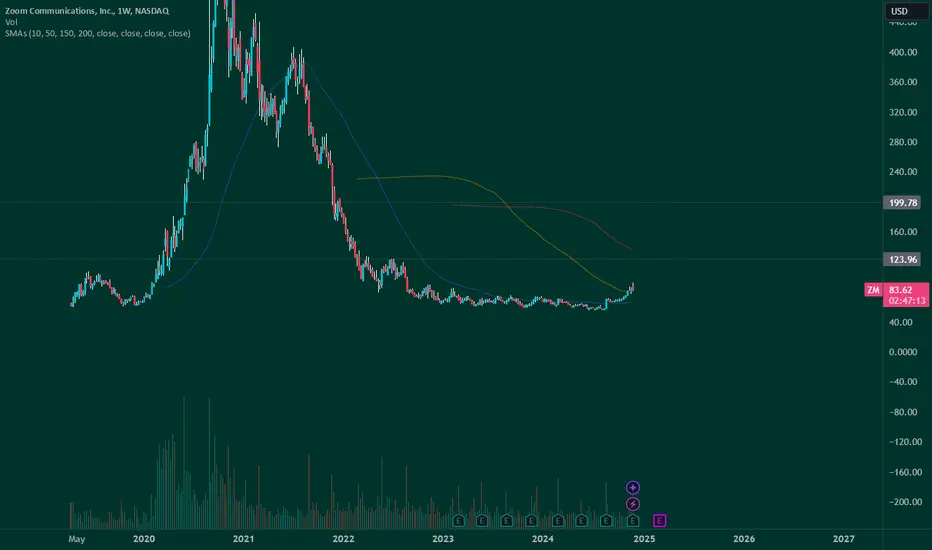
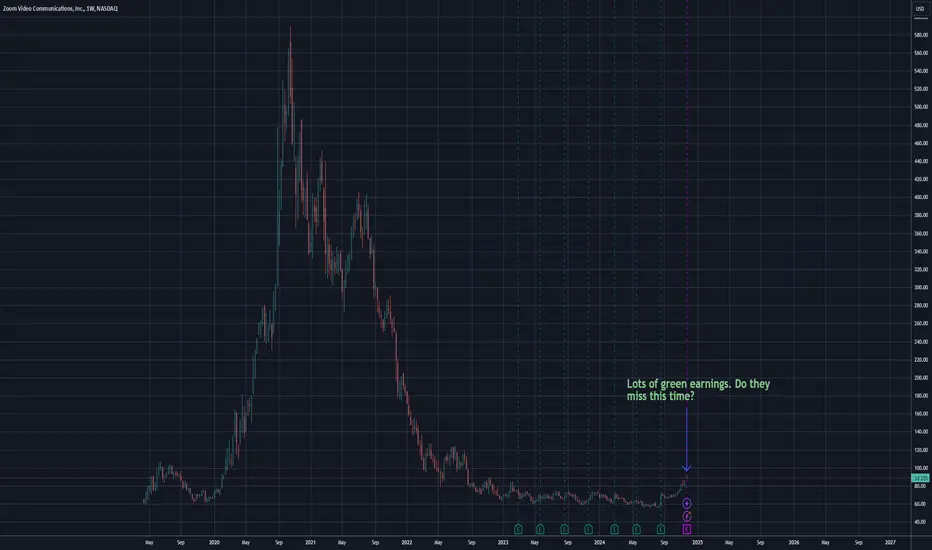
ZOOM squeeze incoming! Which way?Weekly chart looks like a squeeze incoming. Earnings been positive for a longtime. Will they continue? Big move incoming!
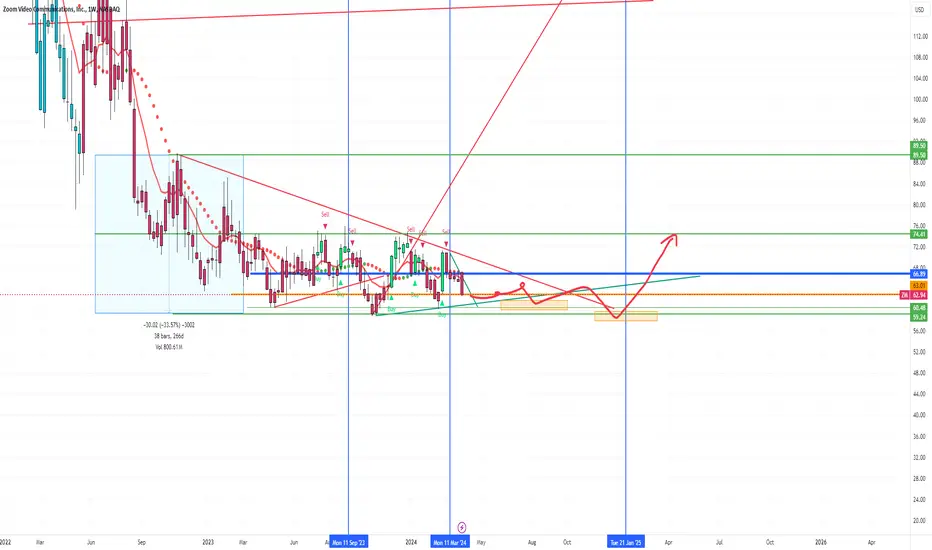
ZM accumulation range ideaHas been accumulating for a while, essentially hit bottom. think based on Bressert we should get final low Jan 2025, mid-term low in august/september. for now in bottom of range good load up area
$ZM HTF move | TP $100+Opened this yesterday when we closed out $etsy. Weekly looks strong with bull side rsi and BB trend finally popping positive for the first time since '21.
TP1: $100
TP2: $121

We are off to the races. $97 is next.We are out of the year long channel and just at the September 2023 resistance.

Zoom Video Communications, Inc. - Bullish divergence*investment opportunity*
A 90% correction since late 2020 on the above 4 day chart. There now exists an excellent opportunity on this stock. Why?
1) Price action and RSI resistance breakouts.
2) Support and resistance, look left. Price action is on past support. Terrific.
3) Bullish divergence. Lots of it, as measured over a 100 day period.
Is it possible price action falls further? Sure.
Is it probable? No
Ww
Type: Investment
Risk: <=6% of portfolio
Timeframe: Act now
Return: Rather awesome. Will say elsewhere.
Stop loss: Will say elsewhere.
